126
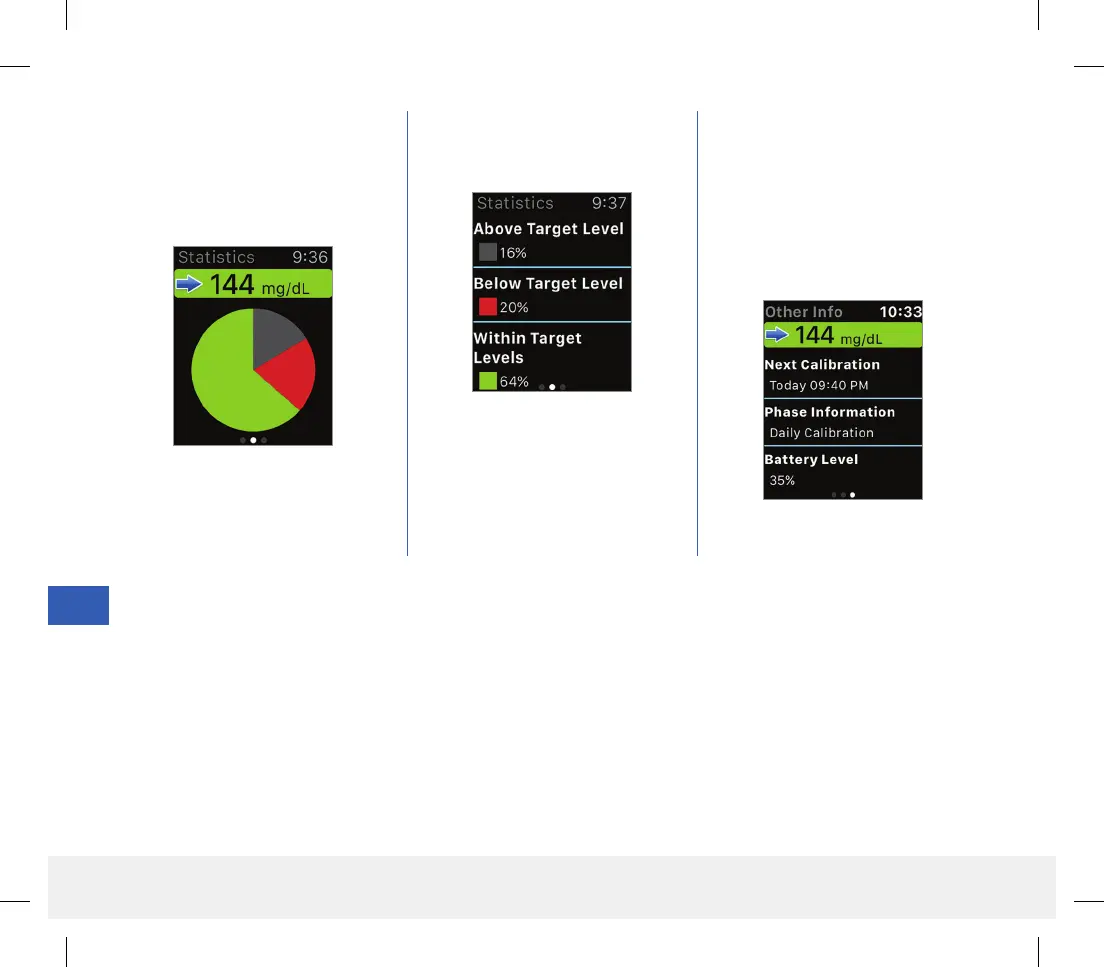
Swipe left to the next screen
showing a pie chart of your total
time within and outside your
target range for the past 24 hours.
Swipe up to display the same data
shown as percentages.
Swipe left to the next screen
showing your current glucose with
trend arrow, your next calibration
time, the current system calibration
phase, and battery level of your
smart transmitter.
LBL-1602-01-001 Rev N_Eversense User Guide_mgdL_R1.indd 126LBL-1602-01-001 Rev N_Eversense User Guide_mgdL_R1.indd 126 2/26/20 12:59 PM2/26/20 12:59 PM