SAIC Exploranium – GR-135 System Manual page: 24
PEAK FWHM SIZE
77 29 34.1 4
197 69 10.9 4
665 221 6.7 17
PRESS ENTER TO CONTINUE
PEAK ANALYSIS
X4 - this selection sets the display to show 1 pixel = 2 channels. This means that the full display
now covers 128 channels = 768keV
X2 - this selection sets the display to show 1 pixel = 4 channels. This means that the full display
now covers 128 channels = 1536keV
Fig. 16
X1 - this selection sets the display to show 1 pixel = 8 channels. This means that the full display
now covers 128 channels = 3072keV
RETURN – goes to the Analysis Menu
Correct operation of the ZOOM feature is to cursor along the display and position the cursor on a
peak of interest, then activate the zoom feature. Once the zoom selection is made the display is
centralized on the peak. As an example:
- the user positions the cursor on the 662keV Cesium peak
- then they select the x8 zoom and press ENTER
- the display now displays only the selected peak at the center of the display and the display
covers only a 384keV range.
Thus the limits of the display are shown as 470-854keV and this range is shown on the display
If the user moves the cursor the cursor stays at the center of the display and the spectrum scrolls
past it until the limits of the display are reached.
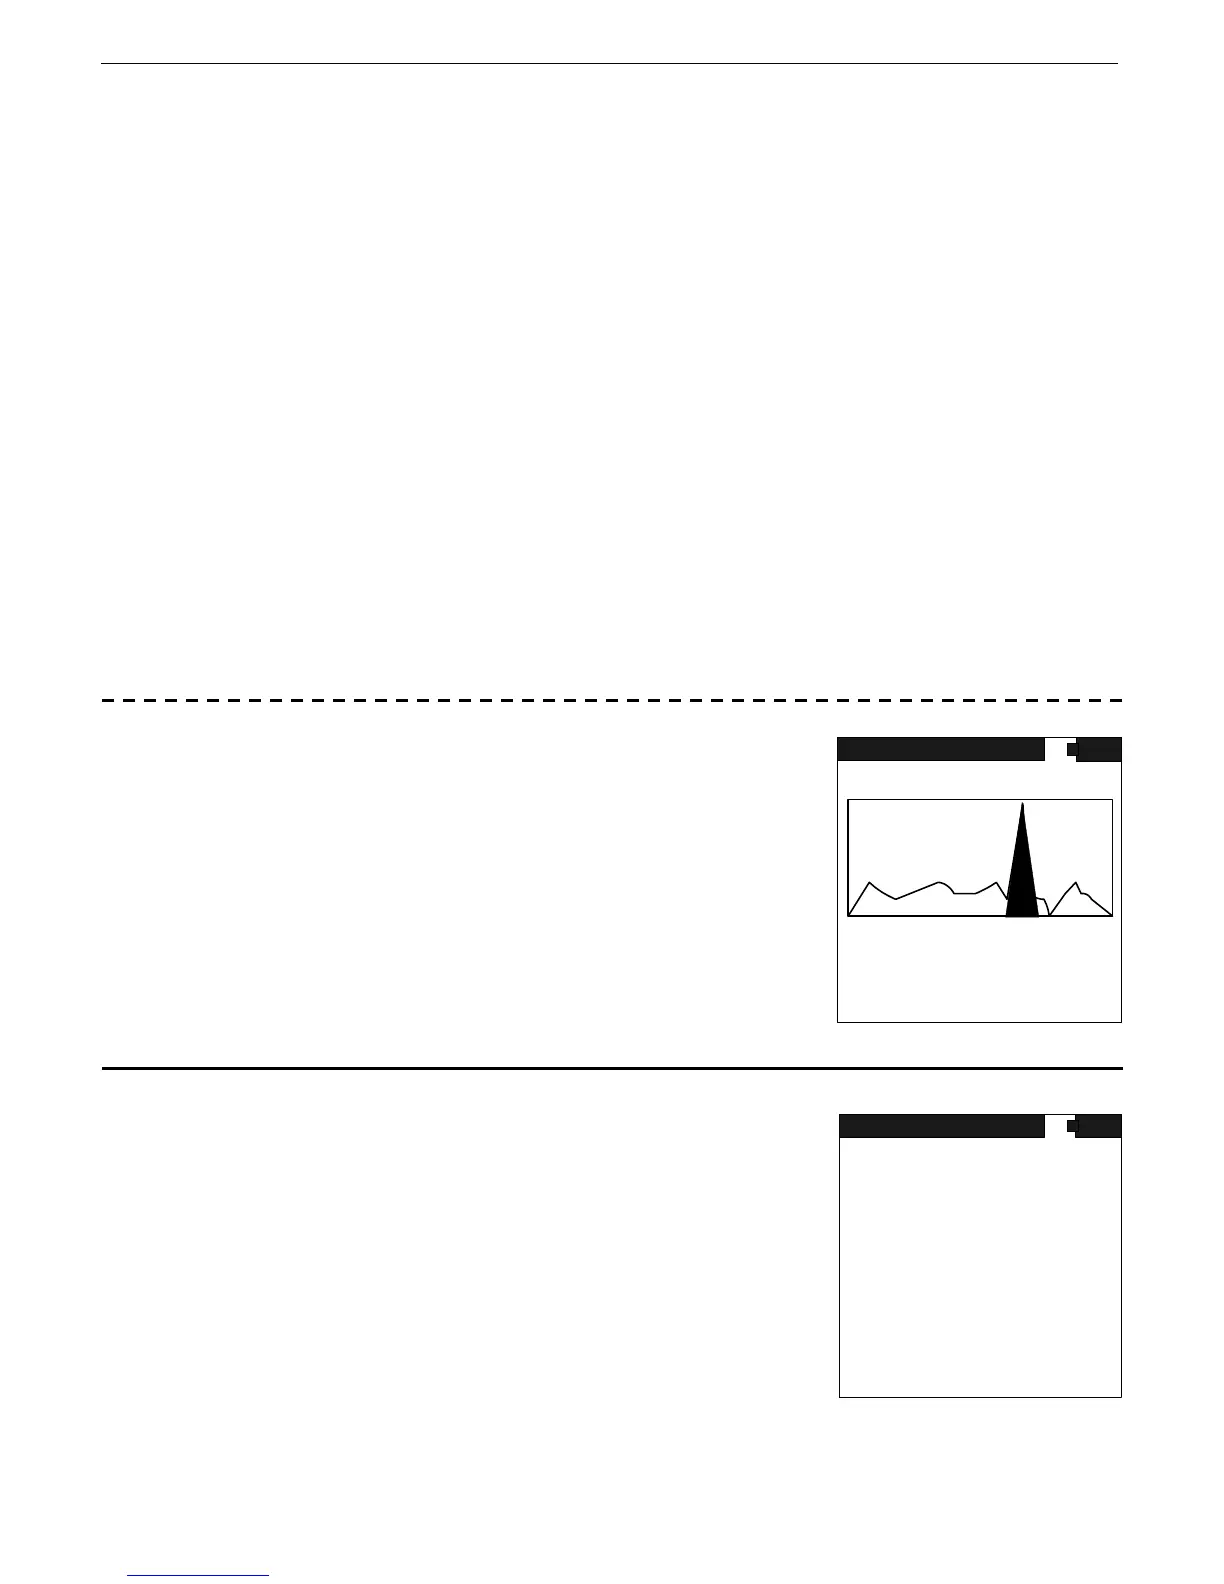
PEAK DISPLAY -
In the SEE SPECTRUM mode as the cursor moves across the display,
any peaks that have been identified in the analysis routine are
highlighted and if the cursor enters this highlighting area the display
shows the peak information on the display as KEV and CH# - as
shown in Fig. 17
If the cursor is moved to the next peak, the first peak will continue
to be displayed until the next peak is entered in which case the
PEAK display shows the new peaks data.
Fig. 17
7.6 PEAK ANALYSIS
Selecting the PEAK ANALYSIS mode results in an automatic analysis
of the last recorded spectrum to identify peaks. The results are
displayed in ascending order, sorted by energy level. Data labels:
Peak - two data are shown, the peak position in keV
(77) and channels (29)
FWHM - Full Width Half Maximum - The computed FWHM of the
located peaks in % gives an idea of the quality of the peak.
SIZE - The amplitude of the peak in SD units
Fig. 18
RANGE 470 - 854 keV
STOP
DETECTOR NAI
CURSOR 1025 KEV 65535 CTS
ROI NO 0 1234567 CTS
VS 2K
ANALYSIS
PEAK 662 KEV 220 CH:
TIME 30 S SET 30 S