110/113/114/115/117
Users Manual
12
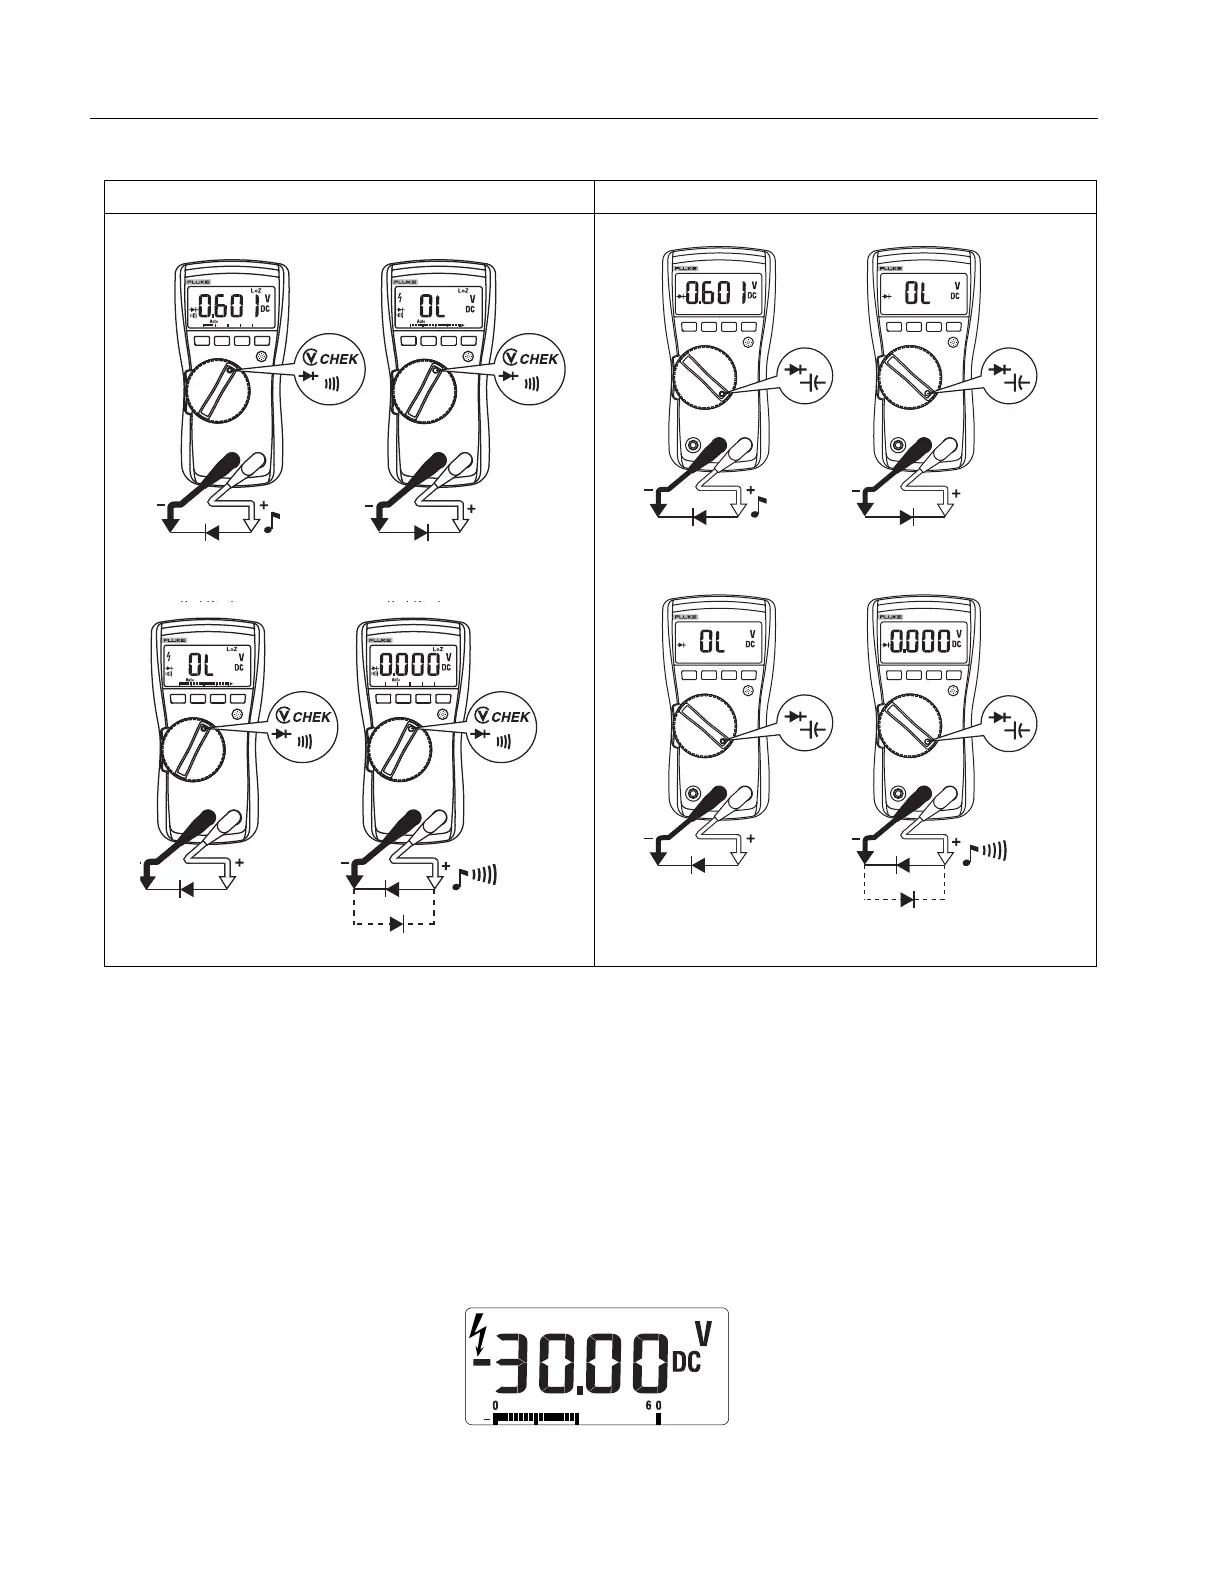
Testing Diodes (113, 115, 117)
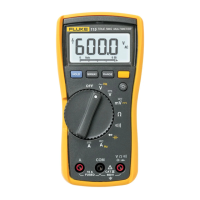
Using the Bargraph
The bar graph is like the needle on an analog meter. It has an overload indicator ( ) to the right and a polarity
indicator (+) to the left.
Because the bar graph is much faster than the digital display, the bar graph is useful for making peak and null
adjustments.
The bar graph is disabled when measuring capacitance. In frequency, the bar graph and range annunciator
indicates the underlying voltage or current up to 1 kHz.
The number of segments indicates the measured value and is relative to the full-scale value of the selected
range.
In the 60 V range, for example (see below), the major divisions on the scale represent 0, 15, 30, 45, and 60 V. An
input of -30 V turns on the negative sign and the segments up to the middle of the scale.
113 115, 117
Forward Bias
Single
Beep
Reverse Bias
Good Diode Good Diode
Good DiodeGood Diode
Forward Bias
Reverse Bias
Shorted
and
Open
Bad Diode Bad Diode
Bad Diode
Bad Diode
Open
Shorted
and
Good DiodeGood Diode
Forward Bias
Reverse Bias
Bad Diode
Bad Diode
Open
Shorted
and