30
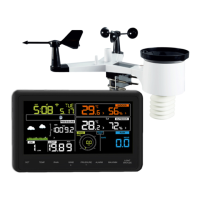
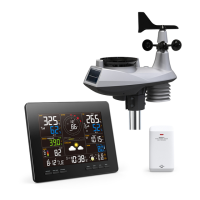
The rate of change of pressure graphic is shown to the left of the
barometric pressure and signifies the difference between the daily
average pressure and the 30 day average (in hPa).
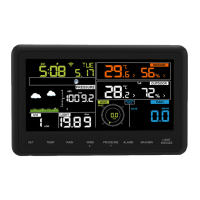
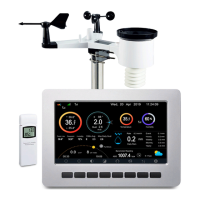
3) Viewing Pressure History
Press the [PRESSURE -] button to view the 12 hour, 24 hour, 48 hour
and 72 hour pressure average.
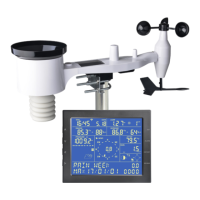
4) Relative Pressure Calibration Discussion
To compare pressure conditions from one location to another,
meteorologists correct pressure to sea-level conditions. Because the air
pressure decreases as you rise in altitude, the sea-level corrected
pressure (the pressure your location would be at if located at sea-level)
is generally higher than your measured pressure.
Thus, your absolute pressure may read 28.62 inHg (969 mb) at an
altitude of 1000 feet (305 m), but the relative pressure is 30.00 inHg
(1016 mb).