Flasher—allows you to show a graphic asher representation on
the far right side of the sonar display. This graphic asher shows
structure and bottom returns much the same as a true asher. You
might nd this feature useful when using sh symbols.
Temperature Graph—allows you to show a temperature graph
along the bottom of the Sonar page.
Background Color—allows you to select the color for the Sonar
page and the sonar on the Map Split page.
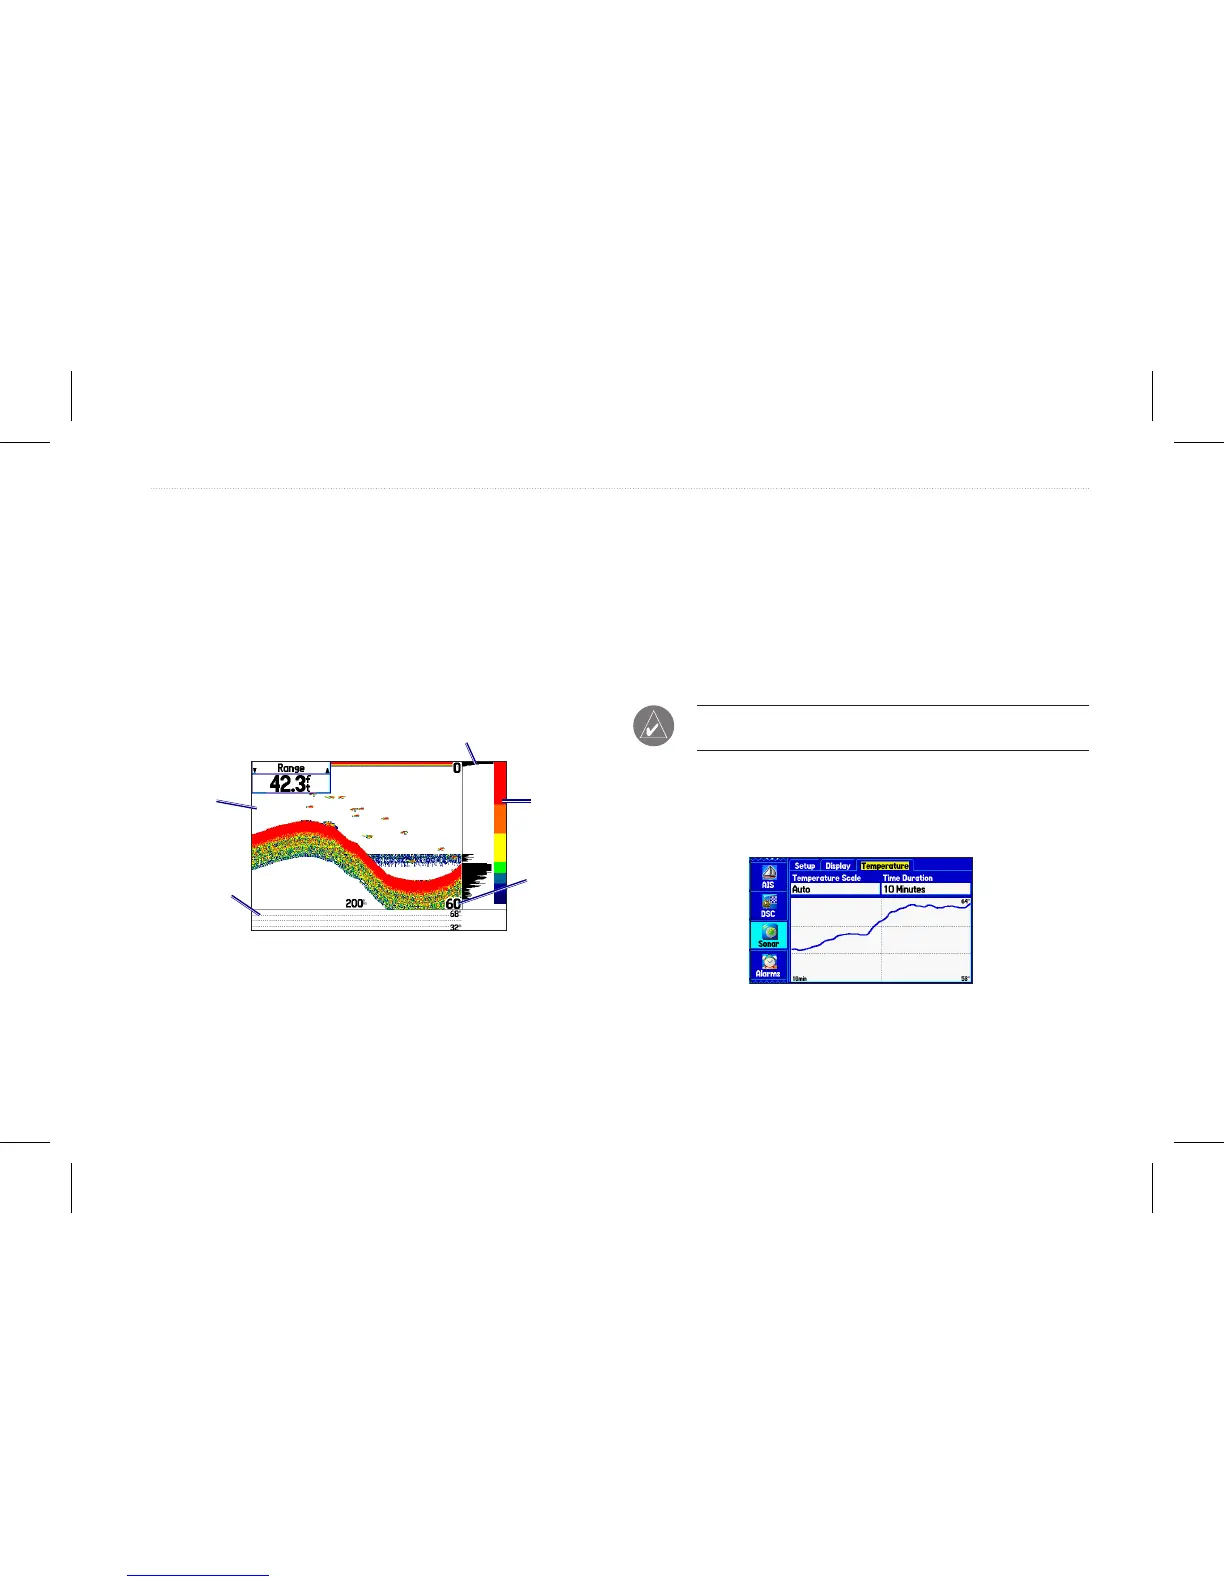
Sonar page with the Sonar Display settings changed
Color bar
Graphic asher
Depth scale
in corners
Temperature
graph
White
background
Viewing the Temperature
Use the Temperature sub tab to view a graph of water temperature
changes over a period of time. The graph reads from right to left
so that the most recent temperature measured appears on the far
right side of the graph. The dotted lines within the graph indicate
intervals in the temperature scale and the duration of time. To view
temperature information, you must select Temp (or Temp, Spd.) as
the transducer type on the Setup sub tab.
NOTE: You must be receiving proper sonar data to view
temperature information.
To access the Temperature sub tab:
1. On the Main menu, highlight the Sonar tab.
2. Select the Temperature sub tab.
Temperature sub tab
GPSMAP 580/585 Owner’s Manual 77
Setting Up and Using Sonar