20
S4: Main Menu
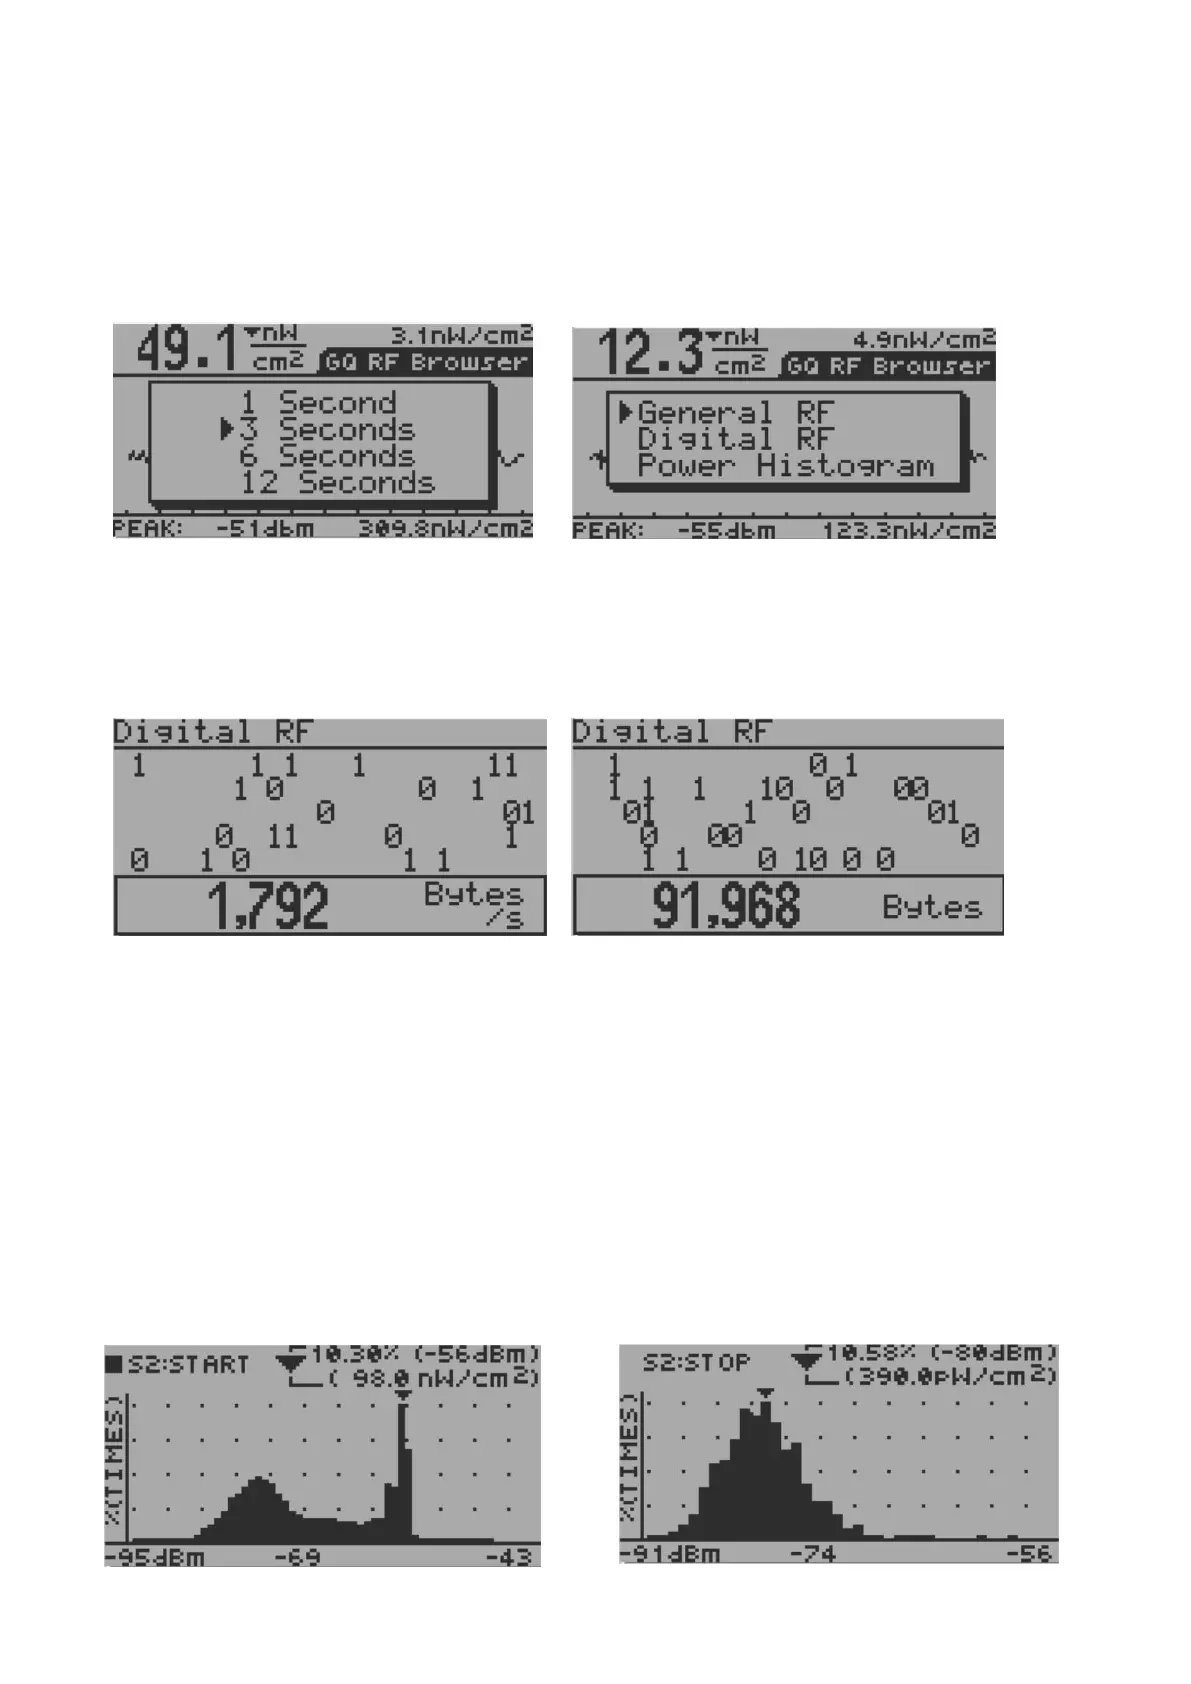
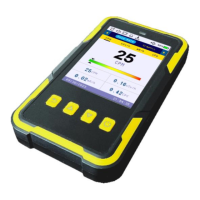
The top left displays peak value in this period.
The top right displays the latest value.
The triangle in graph is the location of peak value.
The lower PEAK indicates the peak reading since in this mode in both units.
Press S2 to change the graph period Press S3 to change the format
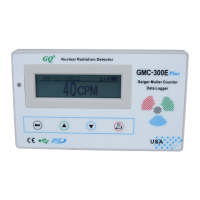
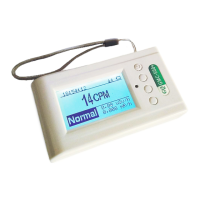
Digital RF
Digital RF is a utility to estimate the total data in byte has been transmitted during a specific selected period
(from 1-12 seconds).
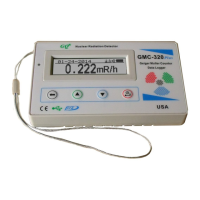
Power Histogram (Time Spectral Power Distribution)
The Power Histogram shows how the RF power distribution is during a specific time period in a statistics
graph (Time Spectral Power Distribution). The horizontal axis is the range of the RF power which has been
detected. The vertical axis gives an amount of times in different power has been detected.
To start a measurement session, press S2 key. Press S2 key again will stop the measurement session. Then
the static result will show in graph. The top right data shows the most times of power in percentage, as well
as in power density.