EasyManua.ls Logo

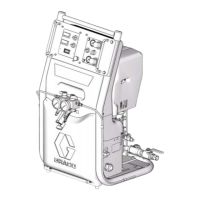
Graco Reactor 2 H-XP3

Graco Reactor 2 H-XP3
78 pages
To Next Page IconTo Next Page
To Previous Page IconTo Previous Page
Loading...
PerformanceCharts
Performance Performance
Performance
Charts Charts
Charts
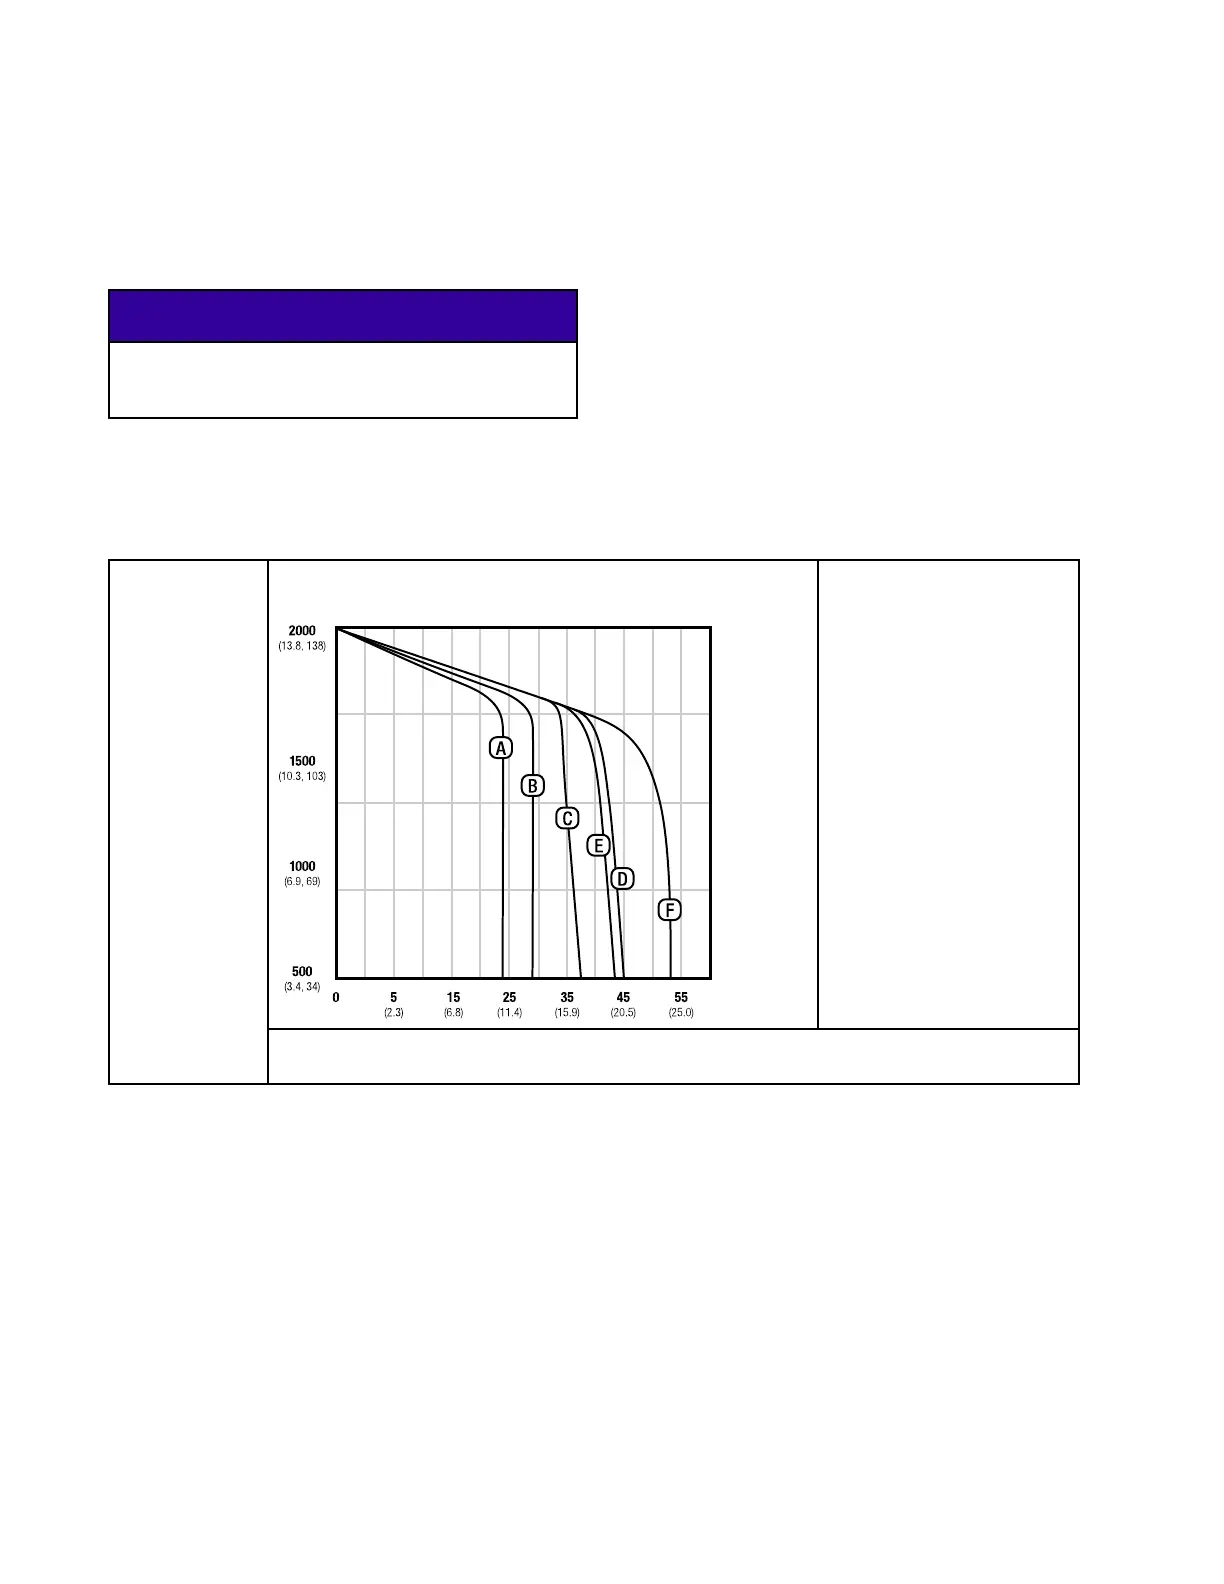
Usethischarttohelpidentifytheproportionerthatwillworkmostef󰘰cientlywitheachmixchamber.Flowrates
arebasedonamaterialviscosityof60cps.
NOTICE NOTICE
NOTICE
Topreventsystemdamage,donotpressurizethe
systemabovethelinefortheguntipsizebeing
used.
Foam Foam
Foam
Performance Performance
Performance
Chart Chart
Chart
Table Table
Table
6 6
6
Foam Foam
Foam
Performance Performance
Performance
Chart Chart
Chart
2000
(13.8, 138)
1500
(10.3, 103)
1000
(6.9, 69)
500
(3.4, 34)
0 15
(6.8)
25
(11.4)
35
(15.9)
5
(2.3)
55
(25.0)
45
(20.5)
A
B
C
E
D
F
ti26328a
KEY KEY
KEY
A=H-30at50Hz
B=H-30at60Hz
C=H-40at50Hz
D=H-40at60Hz
E=H-50at50Hz
F=H-50at60Hz
PRESSUREpsi
(MPa,bar)
FLOWrateinlb/min(kg/min)
72
334945J

Table of Contents

Other manuals for Graco Reactor 2 H-XP3

Related product manuals