Cycle Analyst V3.1 User Manual
Rev 1.0
4 Display Screens
When the device is powered up you can scroll through numerous display screens
by pressing the left and right buttons to show you things of interest:
Table 1: Summary of CA3.1 Display Screens
Display #1, Main Screen Summary of battery level, speed, power, voltage, distance etc.
Display #2, Electrical Only View of just the battery voltage, current, power, and amp-hours
Display #3, Human Power Shows pedal cadence and human power if torque sensor installed
Display #4, Wh/km Battery watt-hours and energy consumed per km or mile
Display #5, Human Stats Average human power, pedal cadence, and total human energy output
Display #6, % Regen Shows regenerative amp-hours and % by which it has extended your range
Display #7, Peak Stats Shows peak current, peak regen current, and battery voltage sag
Display #8, Speed Stats Maximum and average trip speed and total trip time
Display #9, Temp Stats Shows current, average, and maximum temperatures if sensor is attached
Display #10, Odometer Shows both current trip distance and lifetime odometer
Display #11, Batt Info Charge cycle count, total kWh energy used, and Battery internal resistance
Display #12, Diagnostics Live readout of throttle input/output voltages and active limiting flags
Most of the essential information you would want while riding is on Display #1.
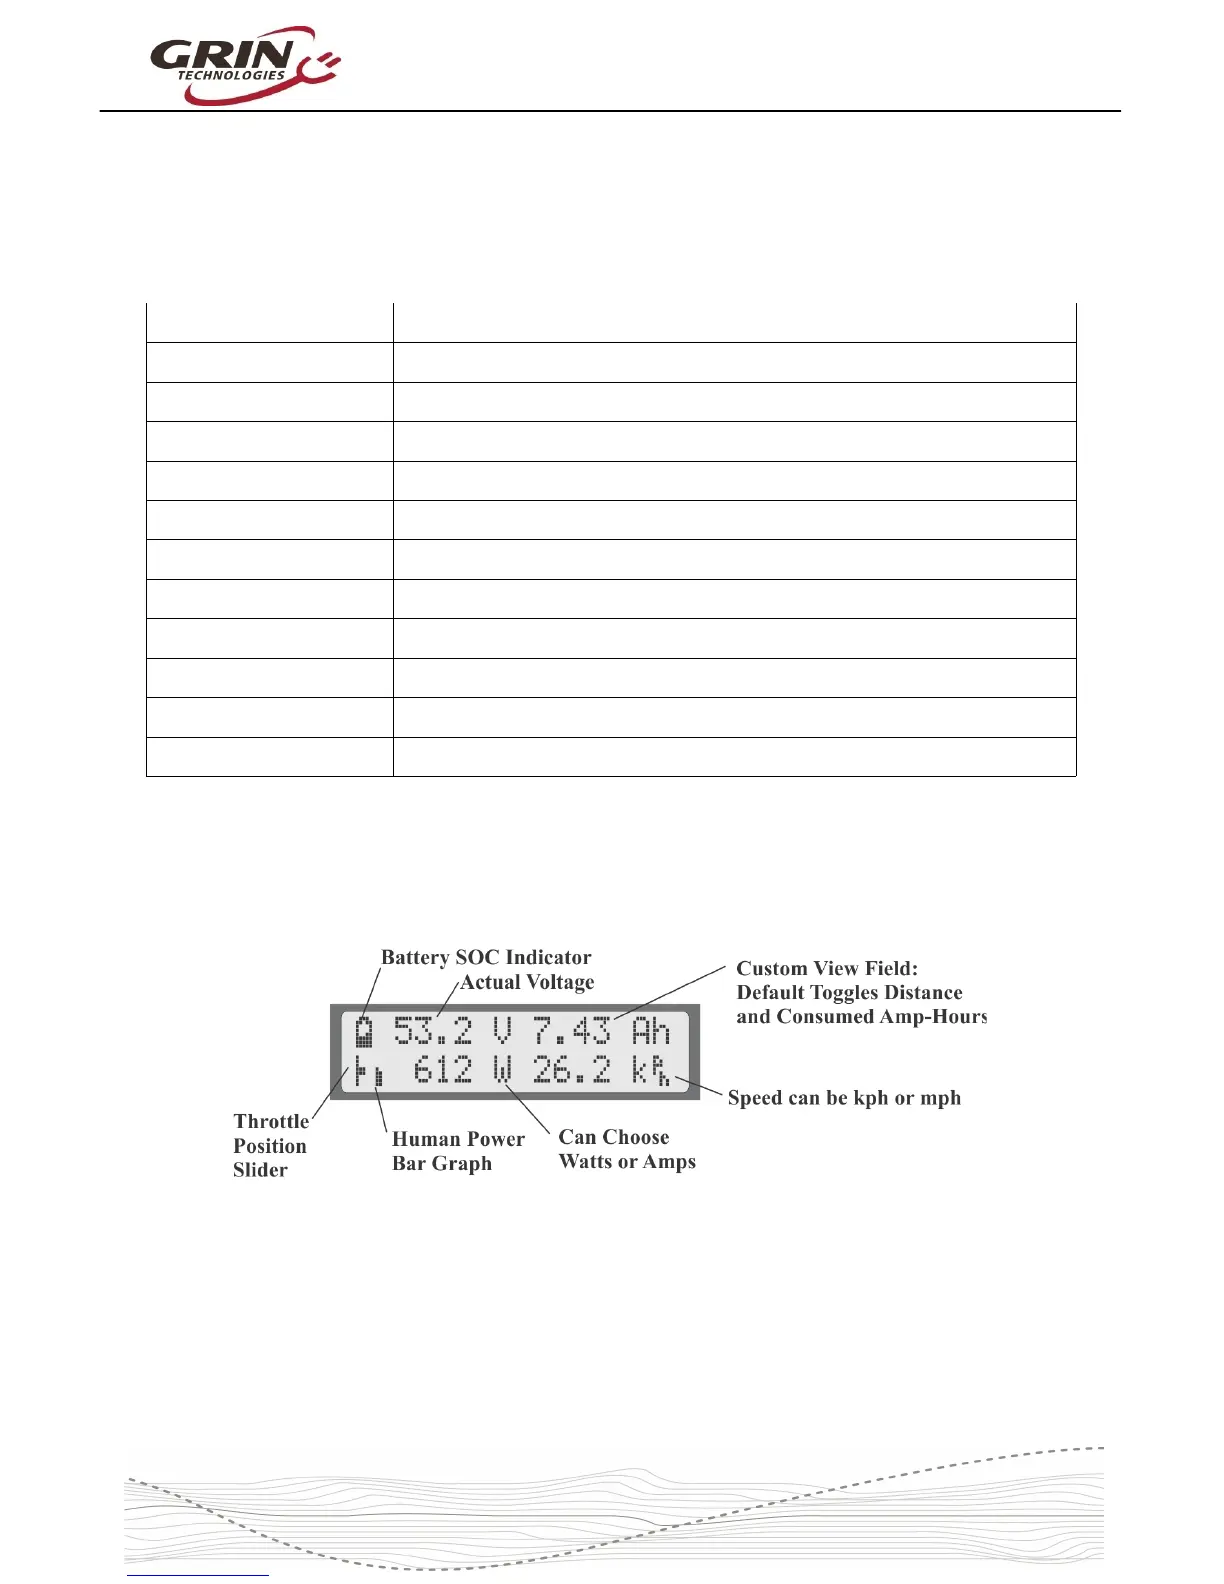
4.1 Main Display
The battery State Of Charge (SOC) icon on the top left is a graphical indication of
the charge level in your battery pack, inferred from a combination of the cell
chemistry, pack voltage, and amp-hour consumption. This gauge will only be
accurate if the battery type and series cell count has been set up correctly.
Next to that is the actual pack voltage. We recommend paying attention to your
battery voltage and becoming familiar with the value that it shows on a full
7