the Corti list for instances when a patient is being tested but the
patient name was not transferred to the Corti.
NOTE: When using the 250 test mode for numbered tests, it is
important to keep a record of the test number for each patient. When
245 tests have been saved, the user will be warned that the memory
is almost full. When the Corti unit reaches 250 saved tests, it will not
allow any further testing. When this occurs, the results must be
printed, transferred to the PC software, or they must be cleared from
memory.
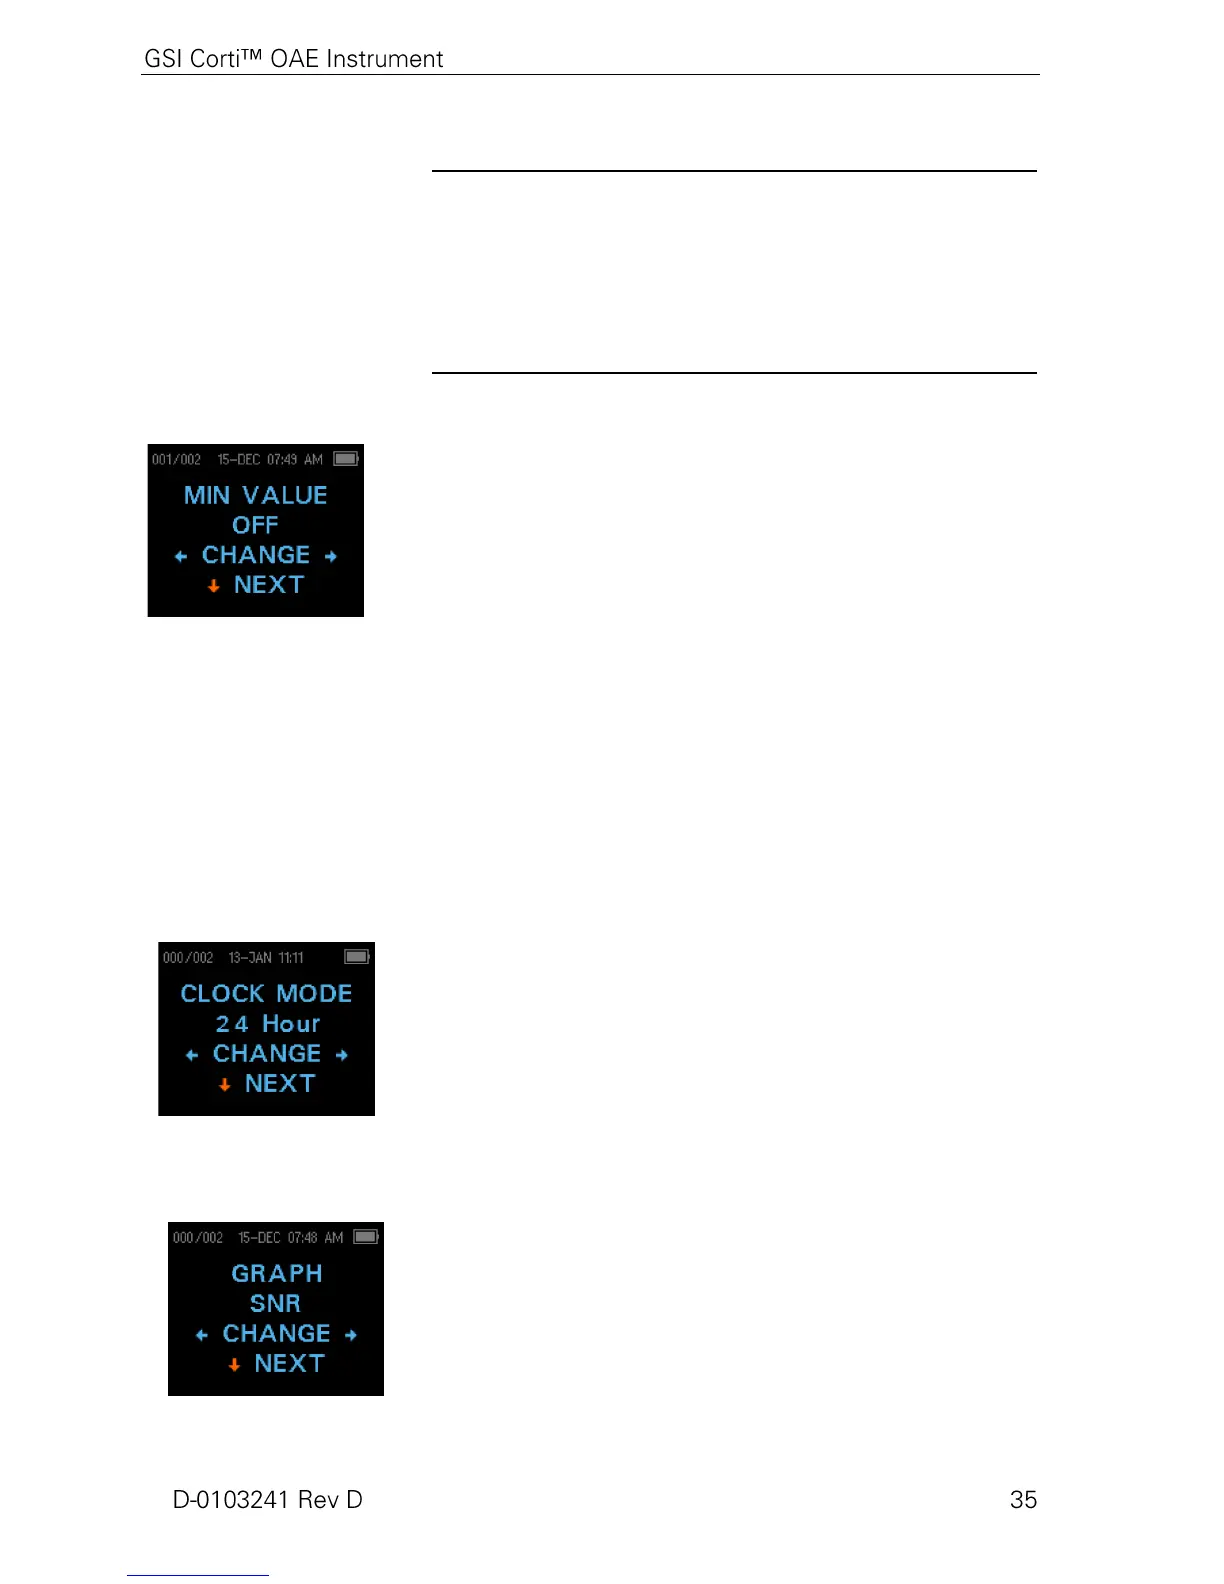
Minimum Amplitude
The Minimum Amplitude setting allows the user to set the unit to
include minimum amplitude values in the pass/refer criterion
(Display 24). If the MIN VALUE is set to “ON,” a result is not
considered a pass unless the amplitude at each frequency is equal to
or greater than the minimum value programmed into the unit. This is
in addition to meeting the other pass criteria including the minimum
SNR and the number of passing frequencies for overall test “Pass.”
The Corti is set with this feature turned OFF when it is shipped from
the factory.
To change the mode to Minimum Amplitude, press the LEFT or
RIGHT arrow keys to select ON or OFF. Once you have made your
selection, press NEXT. NOTE: When Value Graph is the selected
graph style, a horizontal green line will appear at the enabled
minimum amplitude level.
The minimum DP amplitude option is -5 dB SPL.
The minimum TE amplitude options are -5 dB and -10 dB SPL.
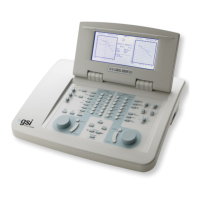
Clock Mode
The Clock Mode menu (Display 25) allows the user to change the
clock from a 24 hour mode to a 12 hour mode. To change the clock
mode, press the CHANGE keys. Press the NEXT to exit this
menu.
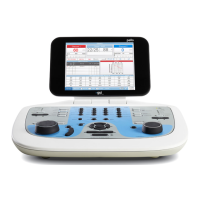
Graph Style
The Graph Style menu (Display 26) allows the user to select from two
options for viewing the results. The SNR graph view shows the
signal-to-ratio for each DP test frequency or TE test band in bar graph
form. The Value graph view shows the absolute emission and noise
levels for each DP test frequency or TE test band.