56
T51002 E
InstallatIon, servIce and troubleshootIng Procedures
APPENDIX B: EXPECTED PERFORMANCE
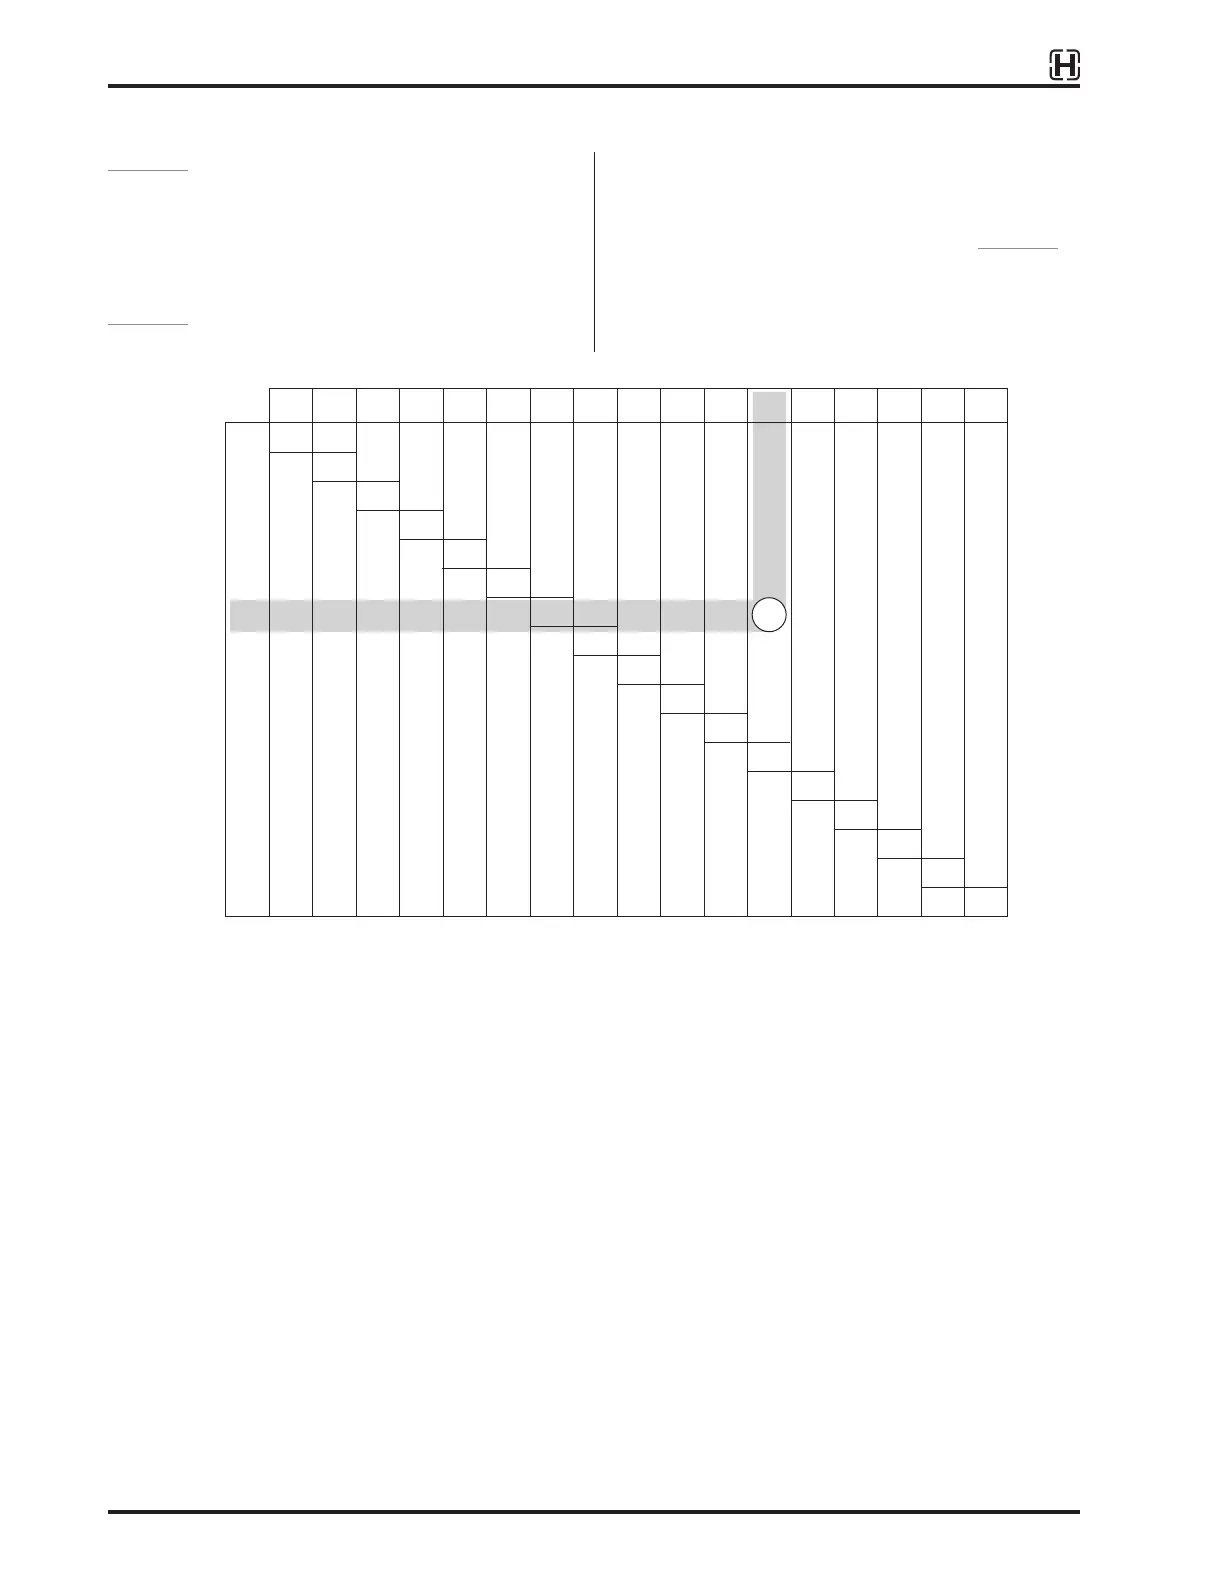
Figure 55 charts expected tire pressure change,
without a Tire Inflation System, relative to changes in
ambient temperature. In the example, the trailer was at
an ambient temperature of 70º F when the tires were
inflated to 100 psi.
Figure 56 plots typical tire pressure changes for a
cold tire inflation to 100 psi. In the chart, the tire
temperature matched an ambient temperature of
70º F when the tire was inflated to 100 psi. The trailer
was then driven to a location where the ambient
temperature was 20º F, per the example of Figure 55.
During travel, the tire pressure dropped to 89 psi
(a difference of 11 psi) when the distinction was
reached.
For example: Target tire pressure is set to 100 psi in Little Rock, Arkansas, where the air temperature is 70
degrees F. The trailer is then driven to International Falls, Minnesota, where the air temperature is 20 degrees
F.
Instead of 100 psi, the pressure in the tires is now 89 psi, due solely to the effects of temperature on pressure.
68
70
72
74
76
78
80
82
84
86
88
90
92
94
96
98
100
120
70
72
74
76
78
80
82
84
86
88
90
92
94
96
98
100
102
110
71
73
75
77
79
82
84
86
88
90
92
94
96
98
100
102
104
100
74
77
79
81
83
85
87
89
91
94
96
98
100
102
104
106
109
80
76
78
81
83
85
87
89
91
94
96
98
100
102
104
106
109
111
70
78
80
82
85
87
89
91
93
96
98
100
102
104
107
109
111
113
60
80
82
84
86
89
91
93
95
98
100
102
105
107
109
111
114
116
50
100
103
105
108
111
114
116
119
122
125
127
130
133
136
138
141
144
-40
-40
-30
-20
-10
0
10
20
30
40
50
60
70
80
90
100
110
120
97
100
103
105
108
111
113
116
119
121
124
127
129
132
135
137
140
-30
-95
97
100
103
105
108
110
113
116
118
121
123
126
129
131
134
137
-20
92
95
97
100
103
105
108
110
113
115
118
120
123
126
128
131
133
-10
90
93
95
98
100
102
105
107
110
112
115
117
120
122
125
127
130
0
88
90
93
95
98
100
102
105
107
110
112
115
117
120
122
124
127
10
86
88
90
93
95
98
100
102
105
107
110
112
114
117
119
122
124
20
84
86
88
91
93
95
98
100
102
105
107
109
112
114
116
119
121
30
82
84
86
89
91
93
95
98
100
102
105
107
109
111
114
116
118
40
73
75
77
79
81
83
85
87
90
92
94
96
98
100
102
104
106
90
Ambient temperature when tire pressure is measured
NOTE: Temperature values in chart above are only for 100 psi target tire pressure.
Figure 55:
Ambient temperature when target tire pressure is set