41
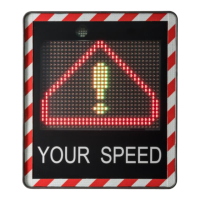
Screenshot 21: defining the speed classes for analysis
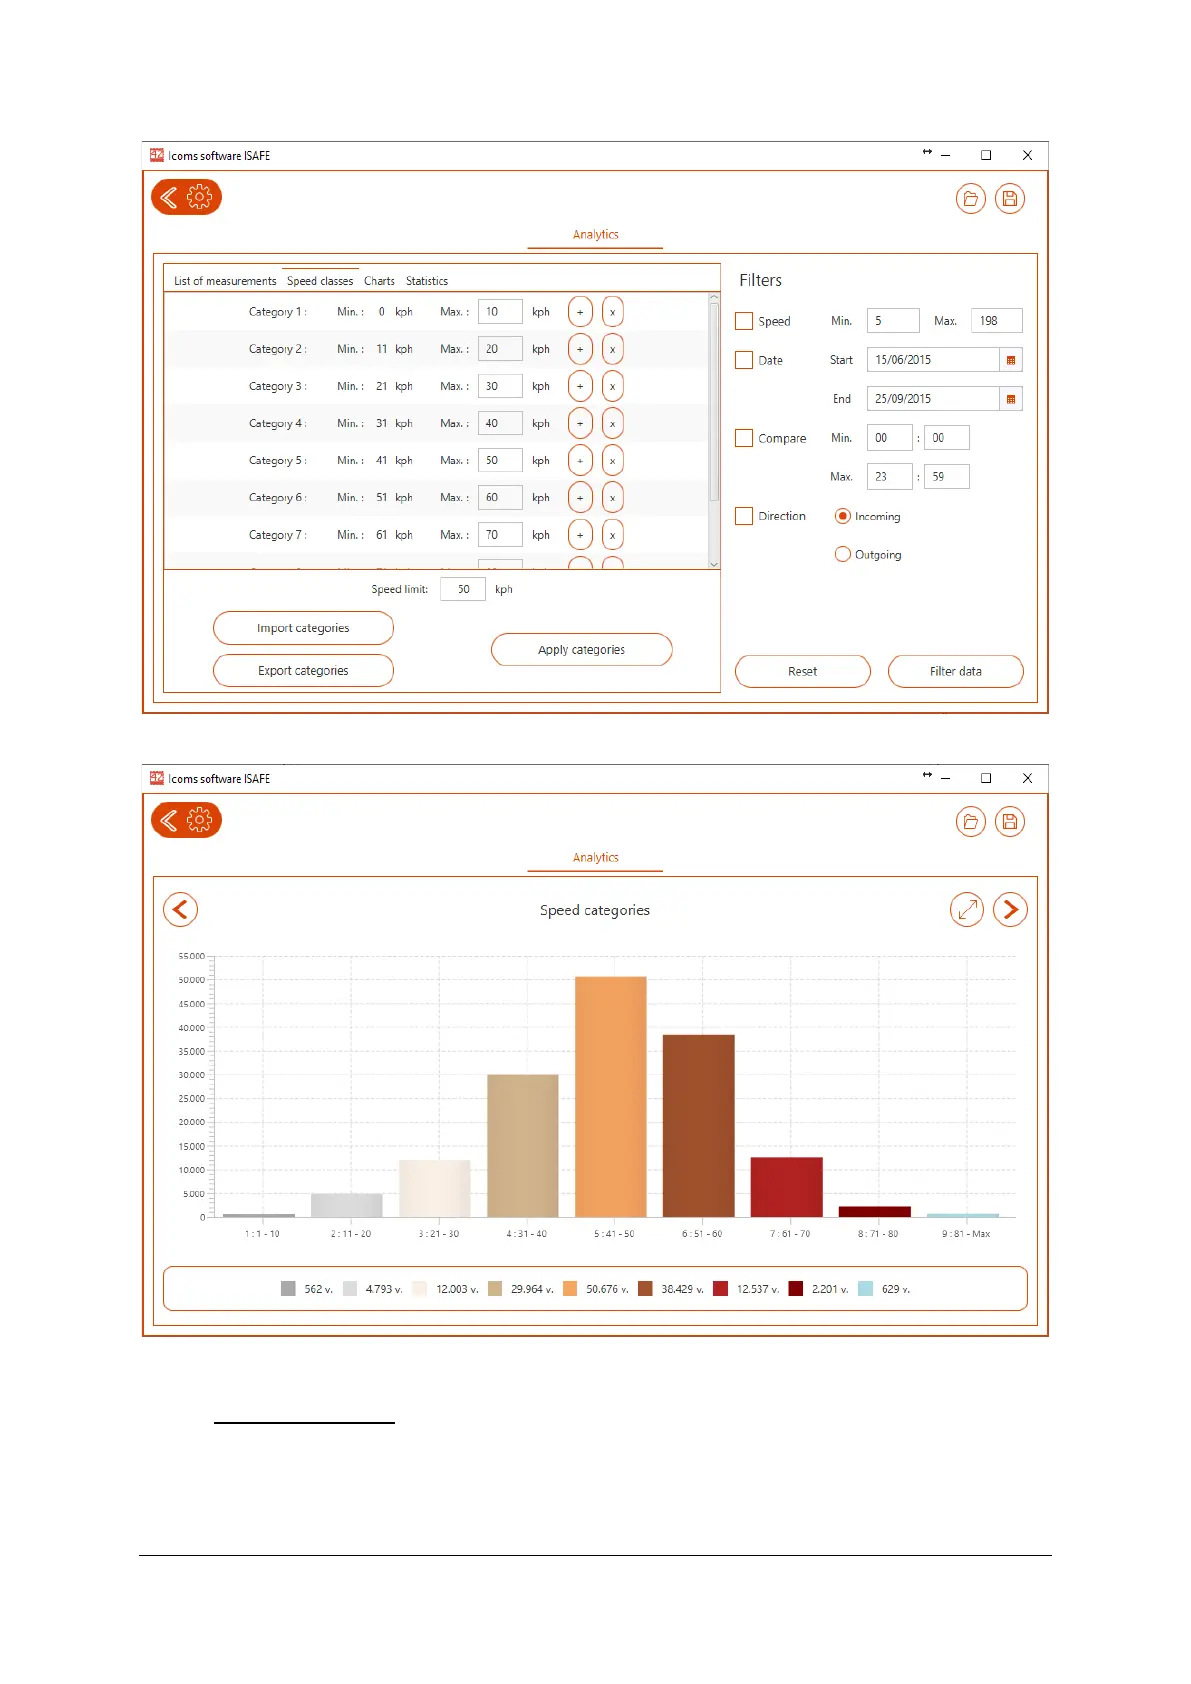
Screenshot 22: graphical overview of the measurements divided in speed classes
6.4.2 General chart
The graph expresses the volume according to time. By checking the boxes located underneath the
graph, you can view the change curves for the average speed, the percentile and the percentage excess
speed in relation to the pivot value set in the “Speed classes” tab.