Keysight E-Series E9300 Operating and Service Guide 15
List of Figures
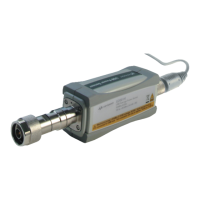
Figure 1-1 Typical Keysight E-Series E9300 power sensor . . . . .20
Figure 1-2 Simplified block diagram of diode pair/attenuator/diode
pair . . . . . . . . . . . . . . . . . . . . . . . . . . . . . . . . . . . . . .22
Figure 1-3 Power meter firmware version screen . . . . . . . . . . . . .24
Figure 2-1 Auto-averaging settings . . . . . . . . . . . . . . . . . . . . . . . .31
Figure 2-2 Example of an 8 MHz bandwidth digital television signal
32
Figure 2-3 Wideband CDMA error of Keysight E-Series E9300 power
sensor versus corrected CW sensor . . . . . . . . . . . .33
Figure 2-4 CDMA (IS-95A): 9Ch Fwd . . . . . . . . . . . . . . . . . . . . . .34
Figure 2-5 Calibration factors versus frequency . . . . . . . . . . . . . .35
Figure 4-1 Zero set performance verification equipment setup . .49
Figure 4-2 Illustrated parts break down . . . . . . . . . . . . . . . . . . . .51
Figure 4-3 Removing power sensor shell . . . . . . . . . . . . . . . . . . .56