46
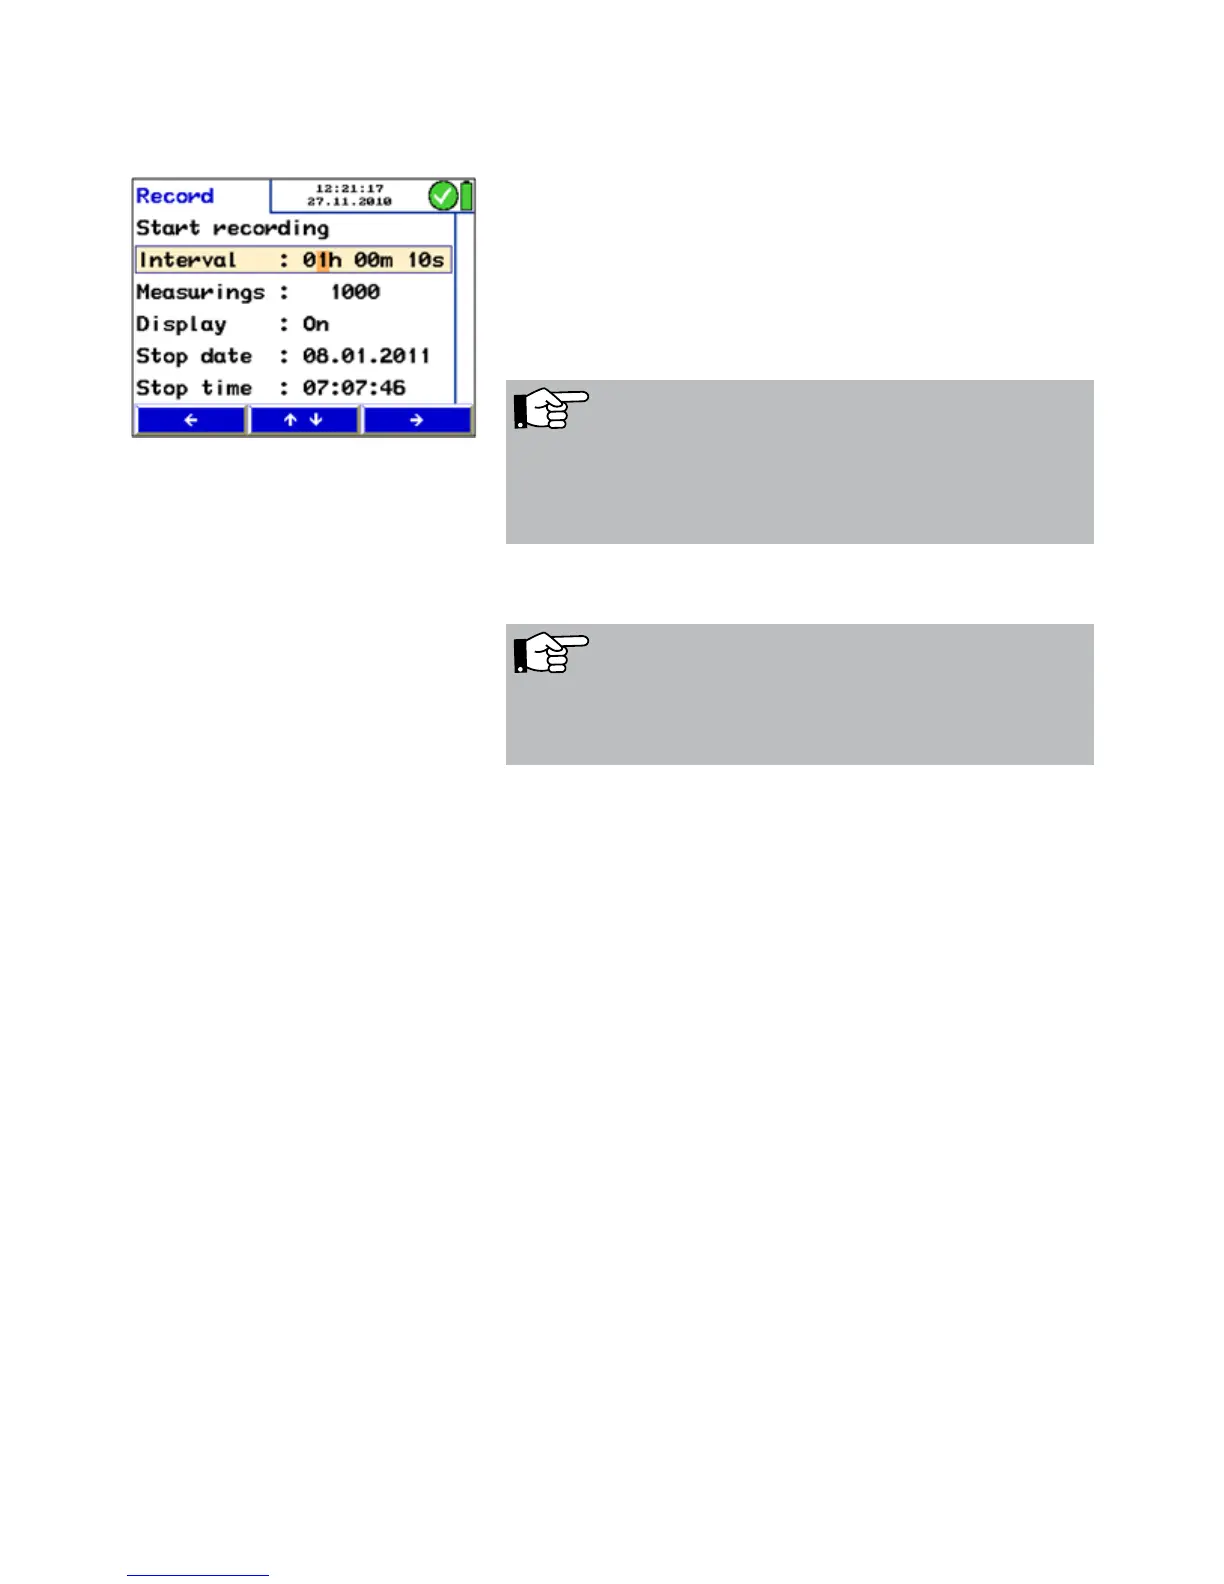
6.10 Option “Graph / Record” The "graph / record" mode is used to start a permanent data
recording. A graph of the records will appear on screen.
The user can modify the log interval, the number of measure-
ments, the stop date and the stop time as follows:
• • Go to the next digit by pressing the left-/right-key
and increase or reduce the value by pressing the up- and
down-keys.
The display can be switched off during the data recording.
Fig. 59: Submenu Logging
NOTE!
The display only will switch off between the measuring
cycles, if a record interval of at least 20 seconds has been
set.
• Select "Start recording" and press "Start"
A graph which presents the measured values appears in the
display.
• Press "Stop" to save the logged data.
• Press "Print" to print a graph.
• Press "Proceed". The request " Accept measurements?"
will appear in the display.
• Press "No" to return to the main menu without saving the
measured values. In this case there will be no tick mark
beside the menu "Graph / logging".
• Press "Yes" to return to the main menu after saving
the measured values. Beside the menu "Graph / Log-
ging" there will appear a tick mark that indicates that the
recorded data have been saved.
After the logging process has stopped select the 'save meas-
urements' option in the main menu screen to save the logged
data as a customer record.
After the logging process has stopped select the 'save meas-
urements' option in the main menu screen to save the logged
data as a customer record.
The data can be transfered to the PC with the Lindab Soft-
ware PC 410 (see accessories).
NOTE!
Ensure that the meter is connected to the power supply or
that the batteries are charged.