LTC2983
62
2983fc
For more information www.linear.com/LTC2983
In addition to digitizing standard RTDs, the LTC2983
can also digitize custom RTDs (RTD type=0b10010, see
Table26). Custom sensor data (minimum of three, maxi-
mum of 64 pairs) reside sequentially in memory and are
arranged in blocks of six bytes of monotonically increasing
tabular data Ω vs temperature (see Table 72).
Table 72. Custom RTD/Thermistor Tabular Data Format
ADDRESS BYTE 0 BYTE 1 BYTE 2 BYTE 3 BYTE 4 BYTE 5
0x250 + 6* Start Address Table Entry #1 (Ω) Table Entry #1 (Kelvin)
0x250 + 6* Start Address + 6 Table Entry #2 (Ω) Table Entry #2 (Kelvin)
0x250 + 6* Start Address + 12 Table Entry #3 (Ω) Table Entry #3 (Kelvin)
• • •
• • •
• • •
Max Address = 0x3CA Table Entry #64 (Ω) Table Entry #64 (Kelvin)
CUSTOM RTDS
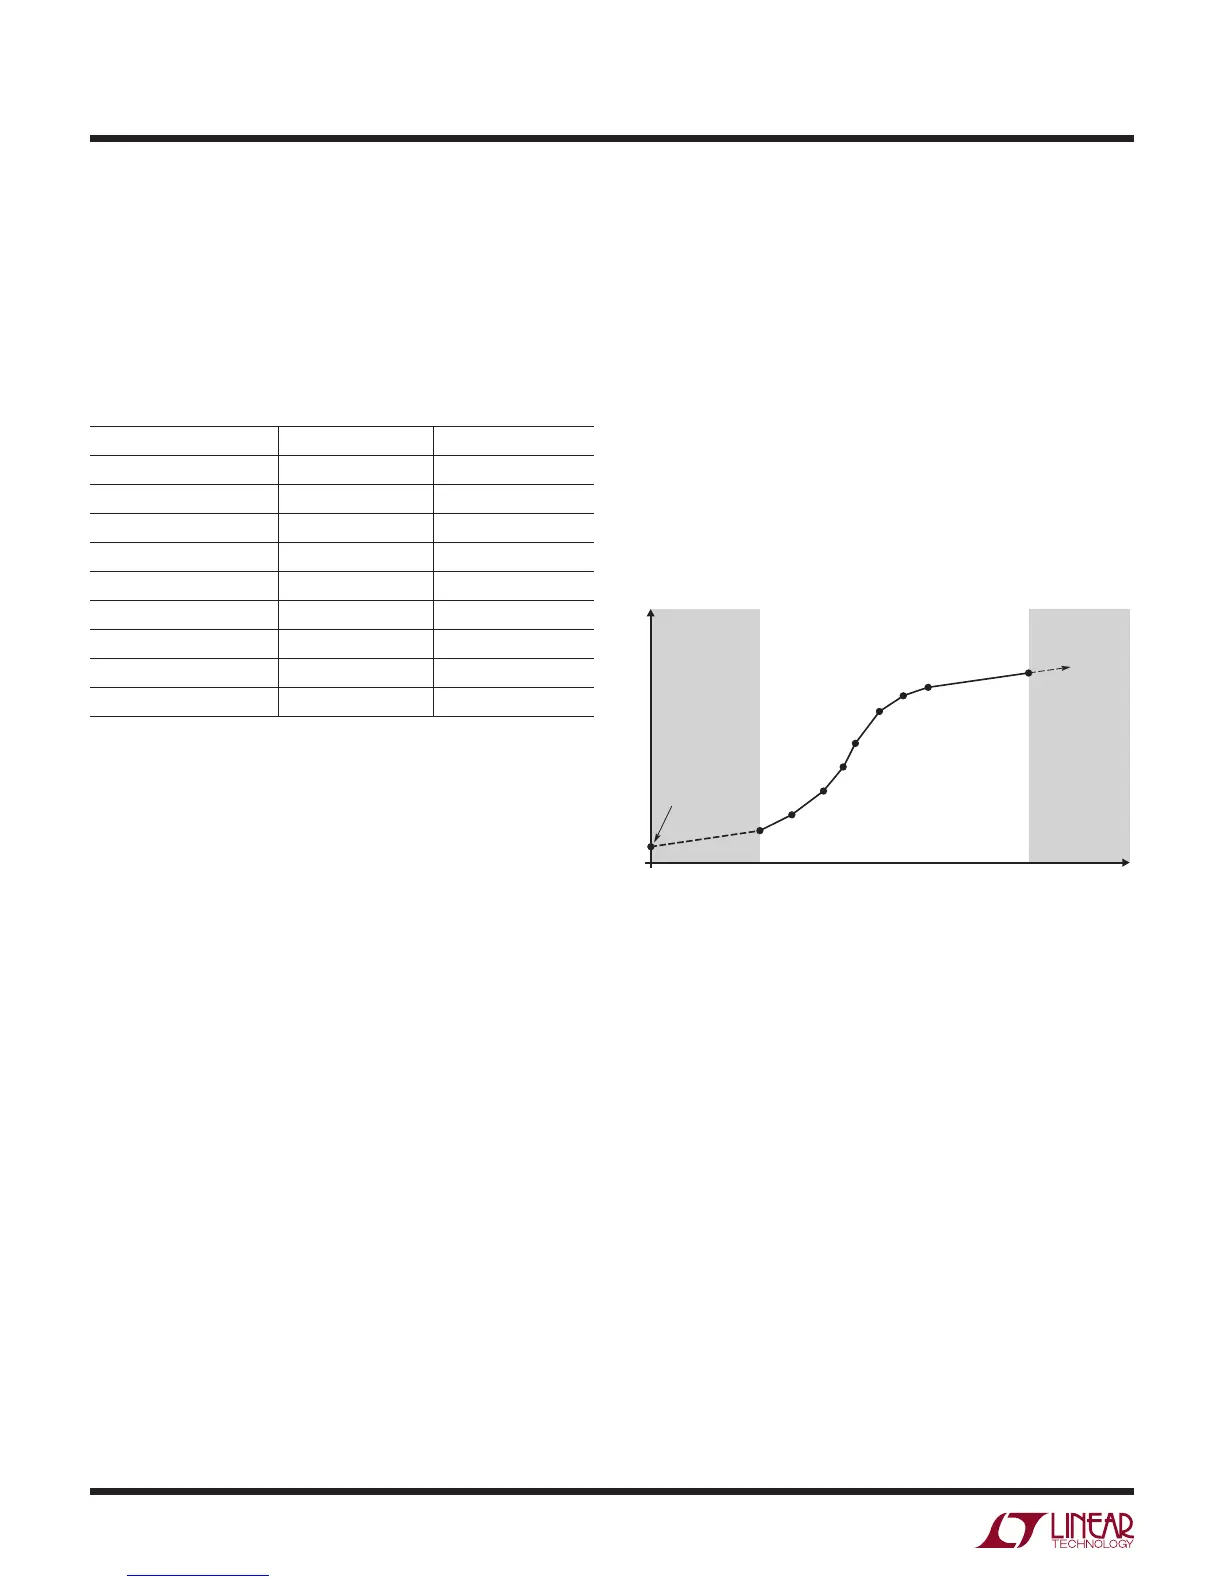
Custom RTD Example
In this example, a simplified RTD curve is implemented (see
Figure 39). Points P1 to P9 represent the normal operating
range of the custom RTD. Resistance readings above point
P9 result in a soft fault and the reported temperature is
a linear extrapolation using a slope determined by points
P8 and P9 (the final two table entries). Resistance read-
ings below point P1 are also reported as soft faults. The
temperature reported is the extrapolation between point
P1 and P0, where P0 is the sensor output temperature
at 0Ω (This point should be 0Ω for proper interpolation
below point p1).
Figure 39. Custom RTD Example (Ω vs Kelvin )
2983 F39
p9
p8
p7
p6
p5
p4
p3
NOTE:
P0 SHOULD BE THE
EXTRAPOLATION
POINT TO 0Ω
RESISTANCE (Ω)
TEMPERATURE (K)
p2
p1
0
0
p0
RESISTANCE < p1
SOFT FAULT
CONDITION
RESISTANCE > p9
SOFT FAULT
CONDITION