Operating Instructions
16
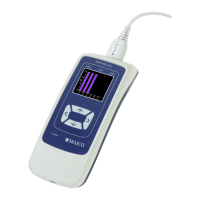
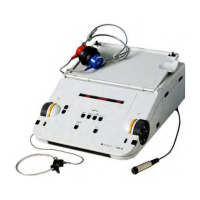
The
SNR graph
shows signal-to-noise ratio (SNR)
frequency. SNR is the difference between the measured emission and
measured noise floor. The SNR is shown on the vertical axis so the
height of each column represents the SNR for that test frequency. For
example, if the column goes to the top of the display then the SNR is
15 dB or greater.
The bright solid yellow columns meet the SNR pass criteria for that
frequency. The hashed columns do not meet the pass criteria set for
that frequency.
Note: if the protocol does not have a pass criteria then all the columns
will appear hashed.
To view test details such as the protocol name, date/time of test, test
number, serial number, OAE signal, noise floor value and signal-to-
noise ratio (numerical
data) press the info button located on the
instrument control under the bottom right corner of the display. Use
the up and down arrow buttons to scroll through the details screen. If
any details are out of the viewable area select SHIFT to extend the
viewable area of the display. When finished viewing the details, select
EXIT to return to the results screen.
From the results screen press any
a
rrow key to bring up the selection box.
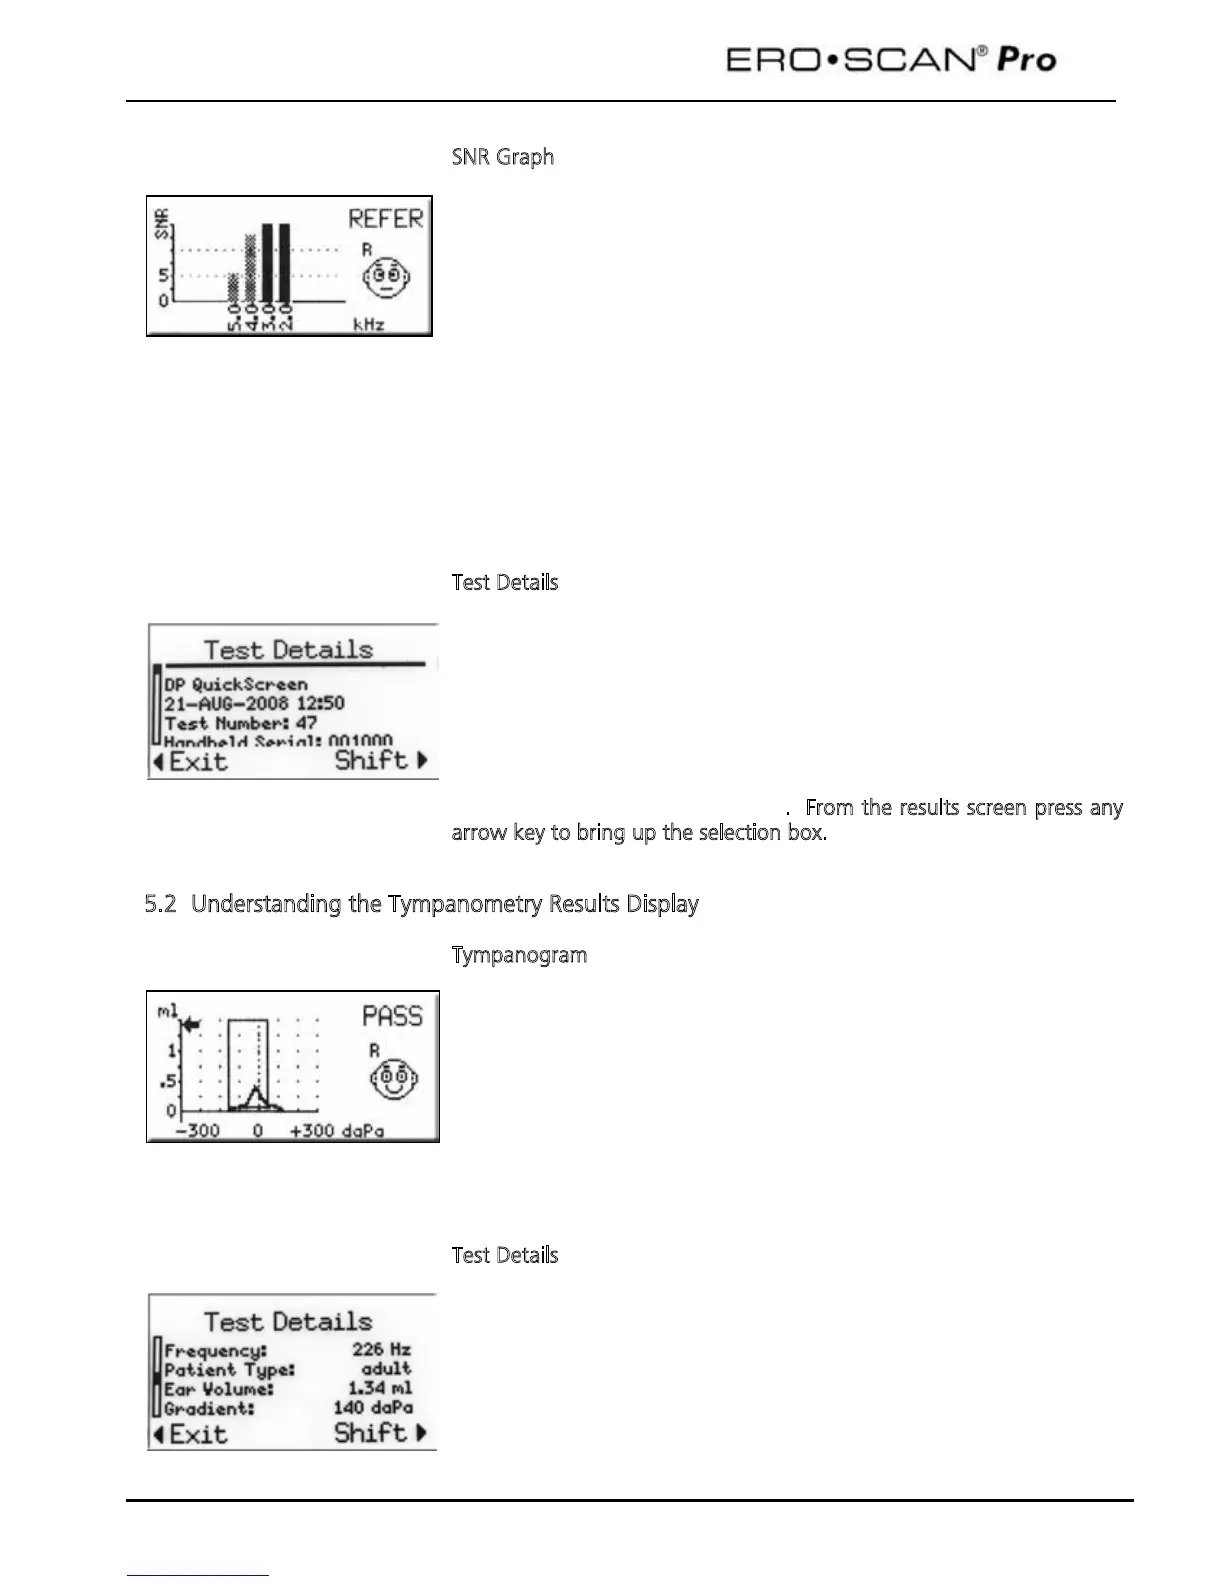
5.2 Understanding the Tympanometry Results Display
After having completed a tympanometry measurement you can see the
results on the display. On the left side of the display you see a graph
of the tympanogram. The area surrounded by the box is valid for
“normal” tympanograms. The curve that appears on the graph
represents the movement of the ear drum. When the peak of the
curve appears inside the box, the screening is generally considered a
PASS. The ear canal volume is represented on the display by the arrow
on the graph directed toward the vertical axis of the graph.
To view test details such as the ear canal volume, gradient, compliance,
and peak pressure (numerical data) press the info button located on
the instrument control under the bottom right corner of the display.

 Loading...