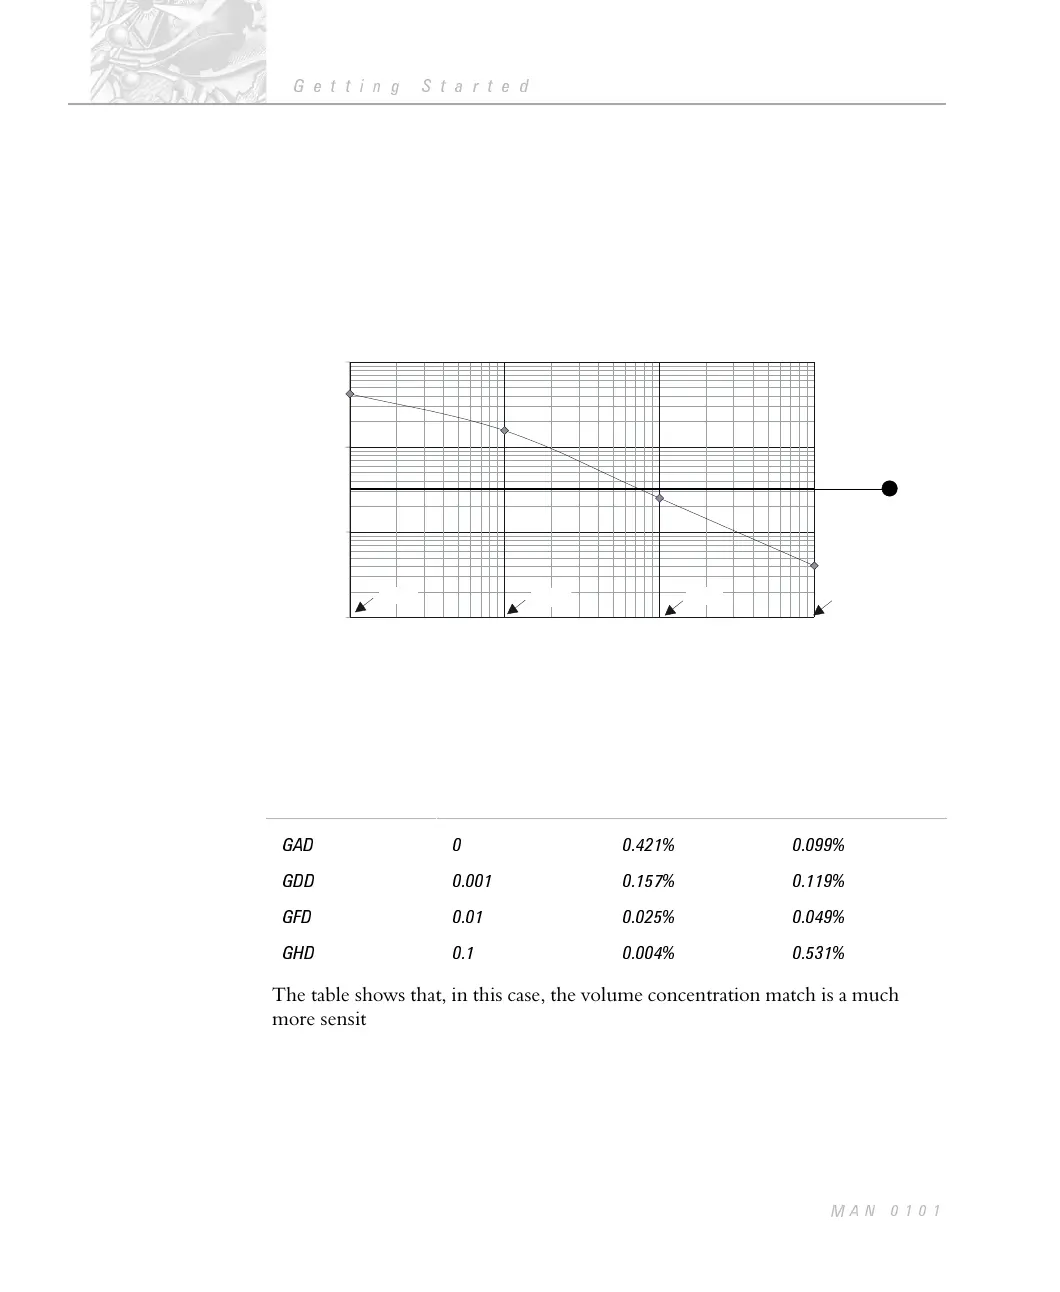
As an example consider the measurements shown below.
A sample of material was suspended in water at a volume concentration of 0.032
%.
The differential refractive index is low and the size around 1µm so that
presentation is important.
The analysis was performed with presentations GAD, GDD, GFD and GHD.
A plot of the log of reported volume concentration against absorption gives:-
The horizontal line at 0.032% À indicates that the closest approximation to the
presentation is GFD with absorption 0.01.
Presentation Absorption Volume
Concentration
Residual
GAD 0 0.421% 0.099%
GDD 0.001 0.157% 0.119%
GFD 0.01 0.025% 0.049%
GHD 0.1 0.004% 0.531%
The table shows that, in this case, the volume concentration match is a much
more sensitive indicator of the absorption than the residual.
0.001
0.01
0.1
1
Particle Imaginary Refractive Index
Volume Concentration %
0.01
0
0.1
0.001
GAD
GDD
GFD
GHD
1
ILL 1885
APPENDIX D
Getting Started
Page D.2
MAN 0101
 Loading...