The presentation data is then made to fit the measurement data - this will
give you the final size distribution.
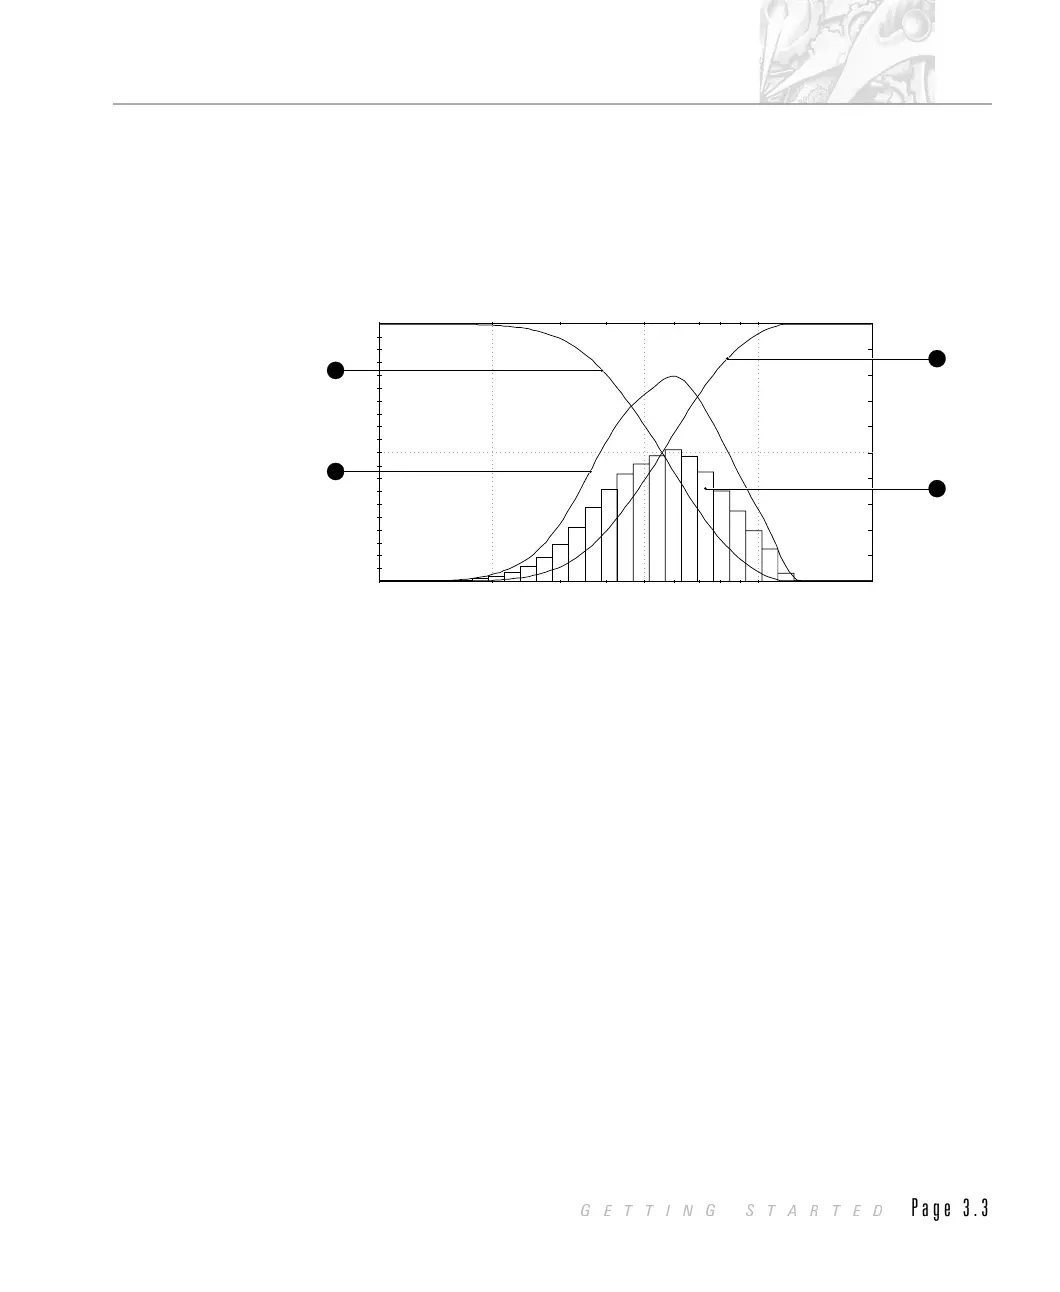
Once the data has been analysed the information can be displayed in various ways.
Usually the display will show you a graph of the result and a table showing the
same information in a tabular form. The graph below shows four of the more
common graph types for displaying the result.
The histogram à displays the result in the form of “in band” percentages. i.e. each
bar in the graph represents a size band of particles (52 - 59 microns for example)
and the height of the bar represents the percentage of the sample that is within
that band. The histogram graph uses the left scale. Unless you change the size
bands, the initial analysis uses the size bands that are set by the physical design of
the detector.
The “undersize” plot À displays the result in the form of “% of sample below a
certain size of particle”. For example by reading the values from the graph you
may be able to determine that 10% of the sample is under 23 microns etc. (the
exact value can be read from the table that will accompany the graph). The
undersize plot is read from the right hand scale on the graph. The undersize plot
is calculated from the initial size bands by fitting a curve to the analysis data so
that values within a size band may be read.
The oversize plot Á is similar to the undersize plot except that the result is in the
form “% of sample above a certain size of particle”. For example by reading the
values from the graph you may be able to determine that 90% of the sample is
above 23 microns etc.
The frequency curve  is calculated by differentiating the undersize curve. The
frequency curve is particularly useful for displaying the results to show the
Particle Diameter (µ m.)
Volume %
0
10
20
0
10
20
30
40
50
60
70
80
90
100
10.0 100.0
2
1
4
3
ILL 1869
CHAPTER 3
GETTING STARTED
Page 3.3
 Loading...