CD 30 ÷ 520
22
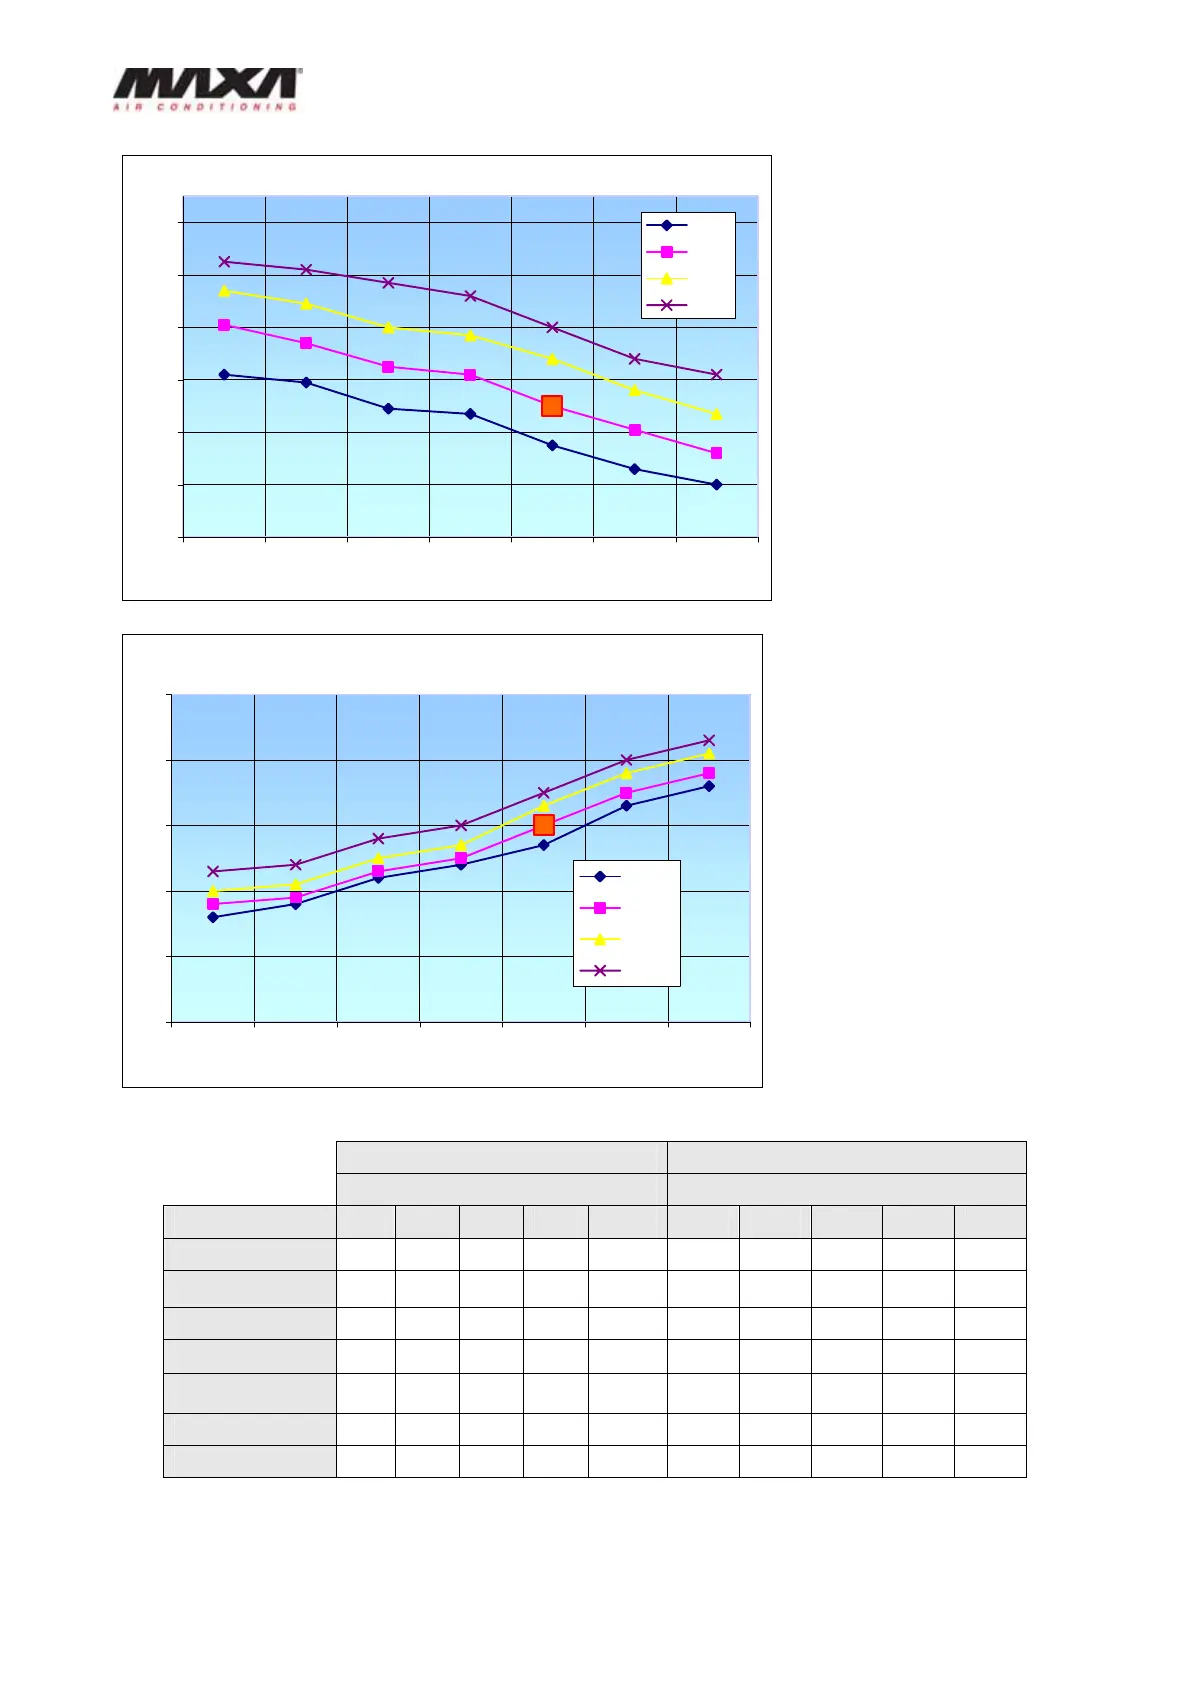
Cooling capacity
25
27
29
31
33
35
37
25ºC 28ºC 30ºC 32ºC 35ºC 38ºC 40ºC
Ambient temperature
Kw
5ºC
7ºC
9ºC
12ºC
Power input in cooling
7
8
9
10
11
12
25ºC 28ºC 30ºC 32ºC 35ºC 38ºC 40ºC
Ambient temperature
Kw
5ºC
7ºC
9ºC
12ºC
Heating capacity Power input
Outlet water temperature Outlet water temperature
Ambient temp. °C 39 42 45 48 50 39 42 45 48 50
13 39.4 38.8 38.1 36.8 36.2 9.2 9.6 10 10.5 11.2
10 36.8 36.2 35.5 34.6 33.6 9.4 9.8 10.3 10.8 10.9
7 33.9 33 32 28.8 30.4 9.0 9.4 9.8 10.3 10.7
2 30.1 29.1 28.2 27.2 26.2 8.8 9.2 9.6 10 10.3
-2 25.9 25 24 23.4 22.4 8.5 8.9 9.4 9.8 10.2
-6 22.4 21.8 20.8 20.2 19.2 8.3 8.7 9.2 9.6 10
-10 20.5 19.8 19.2 18.2 17.3 8.1 8.5 9.0 9.4 9.8
The diagram shows the capacity
progress among ambient
temperature and outlet water
temperature of 5°C, 7°C, 9°C,
12°C
The diagram shows the power
input progress among ambient
temperature and outlet water
temperature of 5°C, 7°C, 9°C,
12°C