CD 30 ÷ 520
24
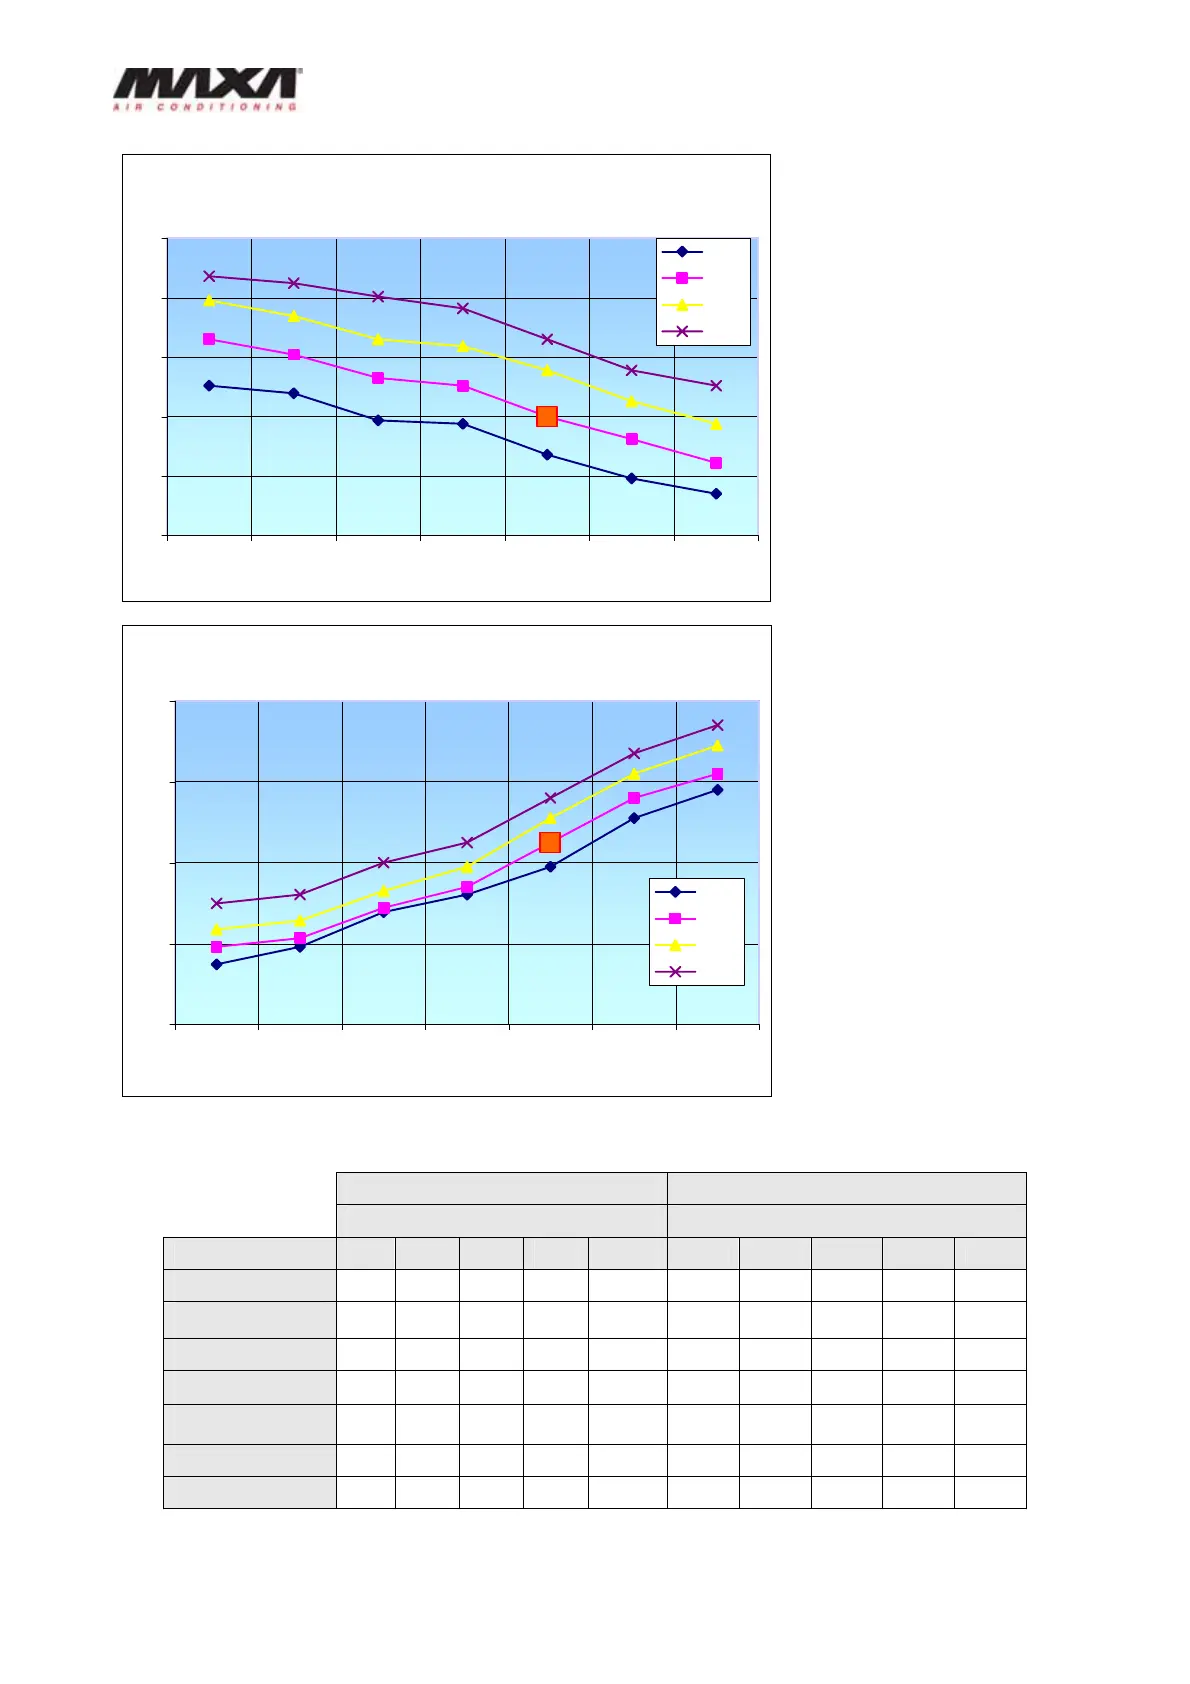
Cooling capacity
55
60
65
70
75
80
25ºC 28ºC 30ºC 32ºC 35ºC 38ºC 40ºC
Ambient temperature
Kw
5ºC
7ºC
9ºC
12ºC
Power input
17
19
21
23
25
25ºC 28ºC 30ºC 32ºC 35ºC 38ºC 40ºC
Ambient temperature
Kw
5ºC
7ºC
9ºC
12ºC
Heating capacity Power input
Outlet water temperature Outlet water temperature
Ambient temp. °C 39 42 45 48 50 39 42 45 48 50
13 84.9 83.5 82.1 79.4 78.0 20.2 21 22.1 23.1 23.9
10 79.4 78.0 76.6 74.5 72.5 19.7 20.6 21.4 22.5 23.3
7 73.1 71.1 69 67.6 65.6 19.3 20.2 21 22.1 22.9
2 64.9 62.8 60.7 58.6 56.6 18.9 19.7 20.6 21.4 22.1
-2 55.9 53.8 51.8 50.4 48.3 18.3 19.1 20.2 21 21.8
-6 48.3 46.9 44.9 43.5 41.4 17.9 18.7 19.7 20.6 21.4
-10 44.2 42.8 41.4 39.3 37.3 17.4 18.3 19.3 20.2 21
The diagram shows the capacity
progress among ambient
temperature and outlet water
temperature of 5°C, 7°C, 9°C,
12°C
The diagram shows the power
input progress among ambient
temperature and outlet water
temperature of 5°C, 7°C, 9°C,
12°C