Technical Description
13
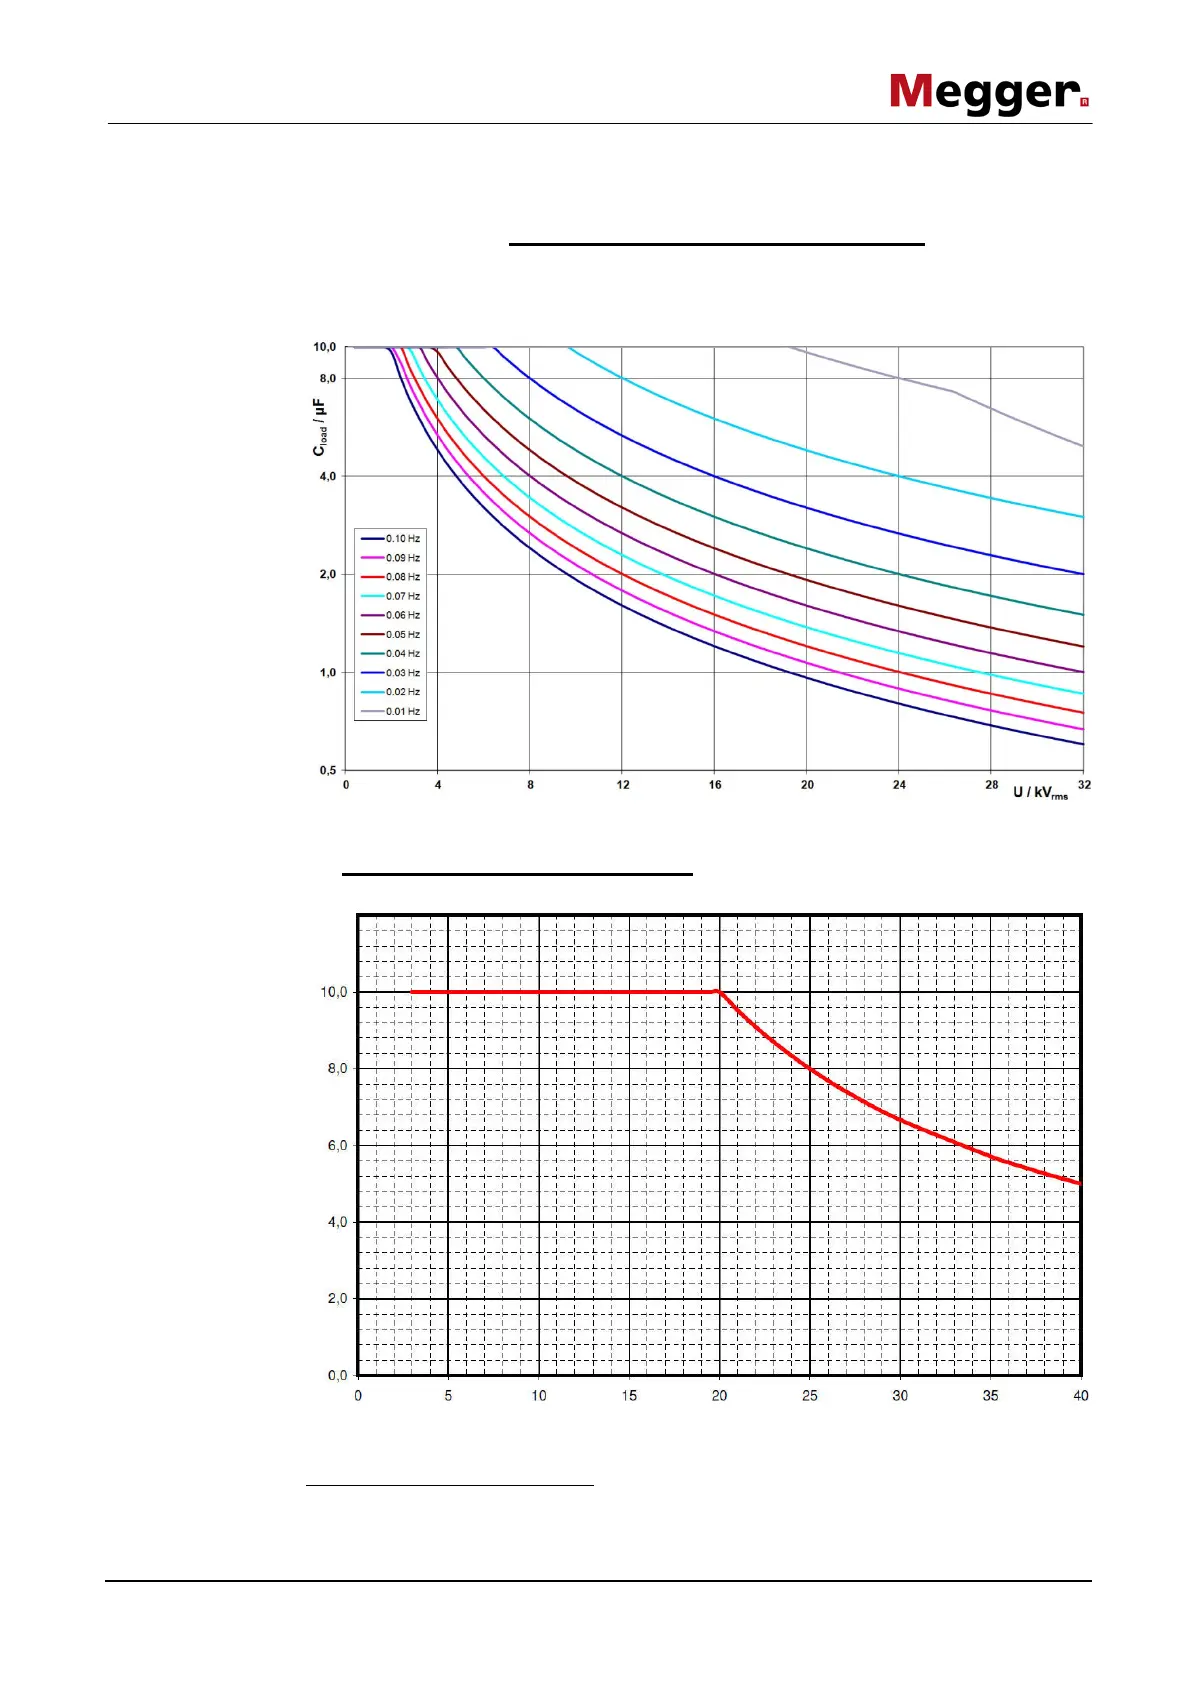
2.3 Load Diagram
The following diagram applies to tests with sine wave voltage only and illustrates the
dependency of the test frequency on the capacity of the load connected and the test
voltage set. If a test frequency cannot be used due to the limits of the test system’s
capacity, the frequency is automatically adapted and the user is informed of this.
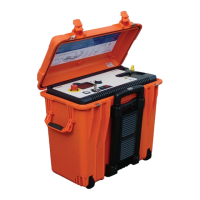
For tests with cosine rectangular voltage, the following load diagram applies
1
:
1
Applies only for temperatures between -25 and 45 °C. In the temperature range from
45 °C to 55 °C, the output power is reduced to 80%.
U / kV