Image Optimization 5-33
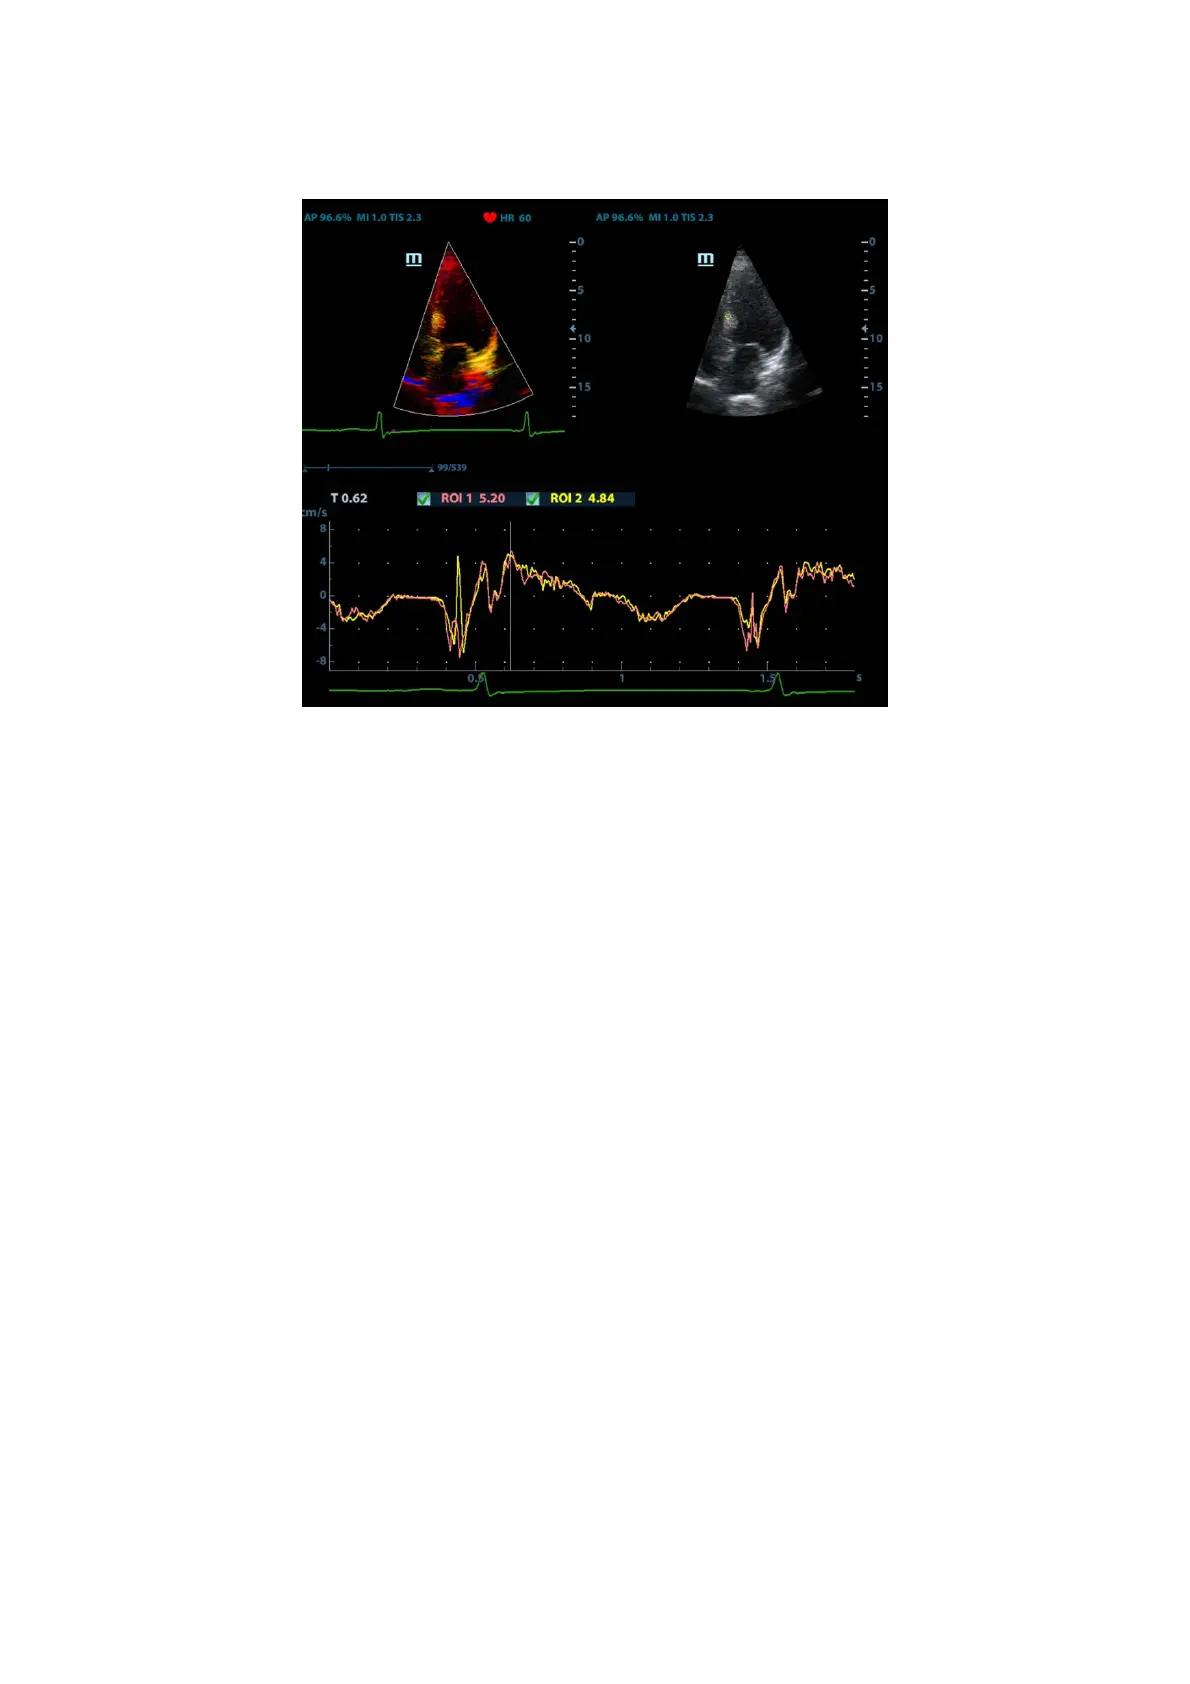
5.9.4.1 TDI QA Screen Description
TDI QA Screen
1 - TVI Cineloop window
Sample area: indicates the sampling position of the analysis curve. The sample area is
color-coded, 8 (maximum) sample areas can be indicated.
2 - B Cineloop window
Tip:
z The images in the TVI cineloop window and B cineloop window are the frozen
image of the same moment. Roll the trackball to review the images in the two
cineloop windows.
z Sample areas are linked in the TVI cineloop window and B cineloop window.
3 - Displays the analysis curve
z The Y-axis represents the speed (unit: cm/s). [In the Strain Rate – Time curve,
the Y-axis represents the strain (%). In the Strain – Time curve, the Y-axis
represents the strain rate (1/s).]
z The X-axis represents the time (unit: s).
z Frame marker: a white line perpendicular to the X-axis which can be moved
horizontally left to right (and right to left) by rolling the trackball.
z Click the checkbox beside the ROI to set whether to hide or display the QA curve.
z You can get the current X/Y-axis value by moving the cursor onto one point on
the curve. If you press <Set> now, the frame marker will move to that spot.
4 - Displays the ECG trace (no ECG trace displayed here).