CUEMIX FX
47
SCOPE CHANNELS
The Scope buttons (Figure 7-7) let you
choose what input channels (as assigned
by the Source menus) will be fed to the
CueMix FX audio analysis (scoping)
features described on the next few pages
(FFT “waterfall” display, Oscilloscope,
X-Y Plot, and Phase Analysis).
AUDIO ANALYSIS TOOLS
CueMix FX provides advanced audio
analysis tools. This section gives a brief
summary. For complete information,
refer to the CueMix FX PDF manual,
which is placed on your hard drive by the
MicroBook installer.
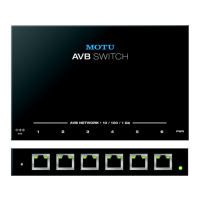
FFT display
The Filter response display section in
CueMix FX can display real-time FFT
and spectrogram information.
Choose Show FFT from the Filter display
options menu (Figure 7-8) to
superimpose a real-time Fast Fourier
Transform (FFT) frequency
measurement curve over the EQ filter
display, as show below:
Figure 7-8: FFT display. Make sure that the
Scope Channels (Figure 7-7) match the
channels that are currently in focus via the
Focus buttons (Figure 7-1).
The FFT curve is post-filter. Therefore,
the FFT shows the results of the EQ
filter(s) being applied.
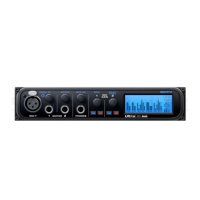
Spectrogram
Choose Options menu> Show
Spectrogram (Figure 7-8) to superimpose
a real-time spectrogram “waterfall”
display in the EQ display background:
Figure 7-9: Spectrogram display.
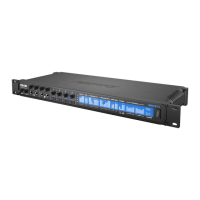
X-Y Plot
The X-Y Plot window (Figure 7-10)
graphs the amplitude of a stereo audio
signal on a two-dimensional grid. To
open the X-Y Plot, choose it from the
Devices menu.
Figure 7-10: X-Y Plot.
For each unit of time (i.e. each sample),
the amplitude of the left channel is
displayed on the x-axis and the amplitude
of the right channel is displayed on the
y-axis. A thick white vertical line marks
FFT curveOptions menu
 Loading...