6. When prompted, remove the capillary tube and
press Continue.
7. Enter any Required or Optional information while
the analysis is running.
NOTE:
The sample will remain on screen until all Required elds
have been entered.
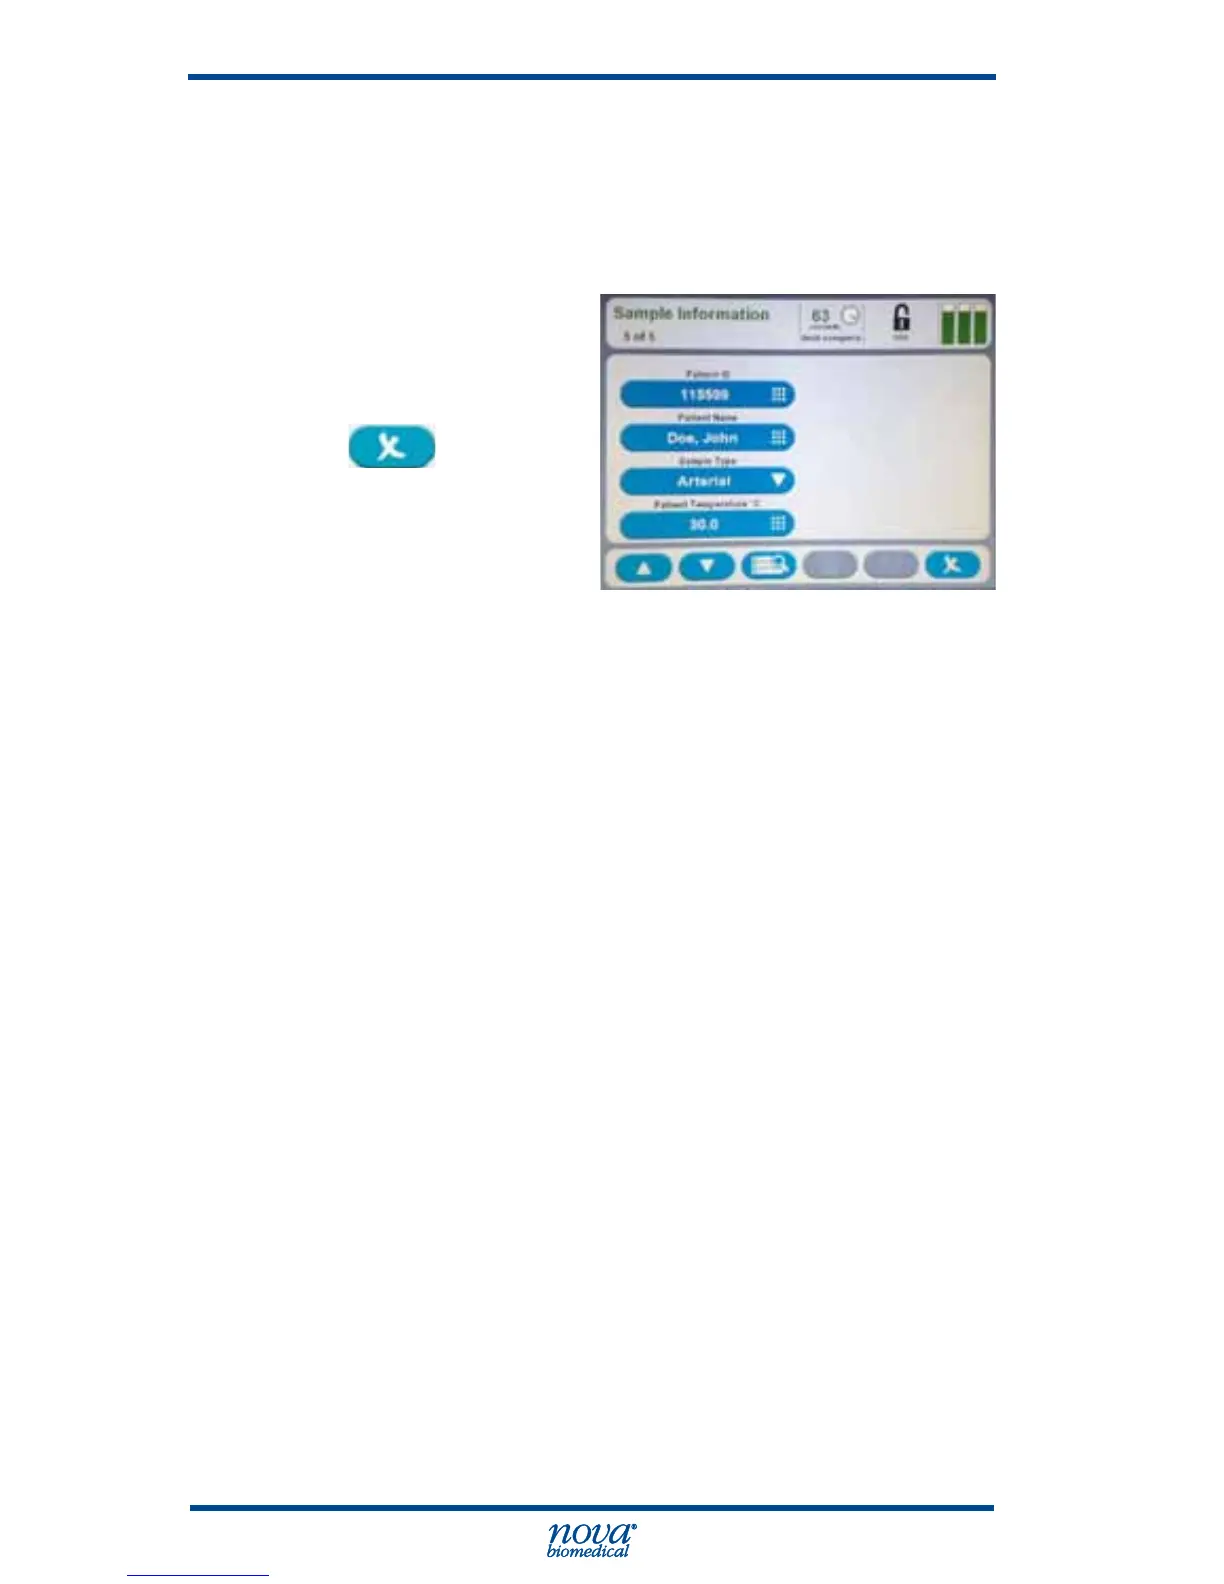
The analysis can
be cancelled by
pressing the X icon
but results
will not be printed
or transmitted.
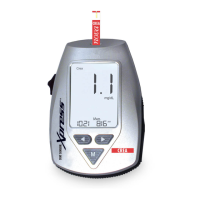
Figure 3.20 Sample Information Screen
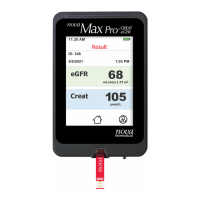
3.2 The Sample Results Display
Once the sample analysis is complete, results for the selected
and calculated analytes are shown on the following screen
for Blood Results. Each analyte is shown with its measured
value, the unit of measure, and a bar graph that provides a
visual indication of the sample concentration.
The bar graph consists of 3 sections.
The rst (left hand) section indicates the sample result is
lower than the entered normal range.
• The segment is displayed with a Orange background
if a sample result is between the low Normal and
low Alert range.
• The segment is displayed with a Red background
when a sample exceeds the low Alert range.
The middle section indicates the sample result is within the
entered normal range.
• The segment is displayed with a Green background
when the sample result is within the entered normal
range