highlight graphs.
x
10
x
10
100- 0015100-0015 1 515
L
NN
x
10
x
10
L
NN
x
10
x
10
L
NN
[364 8x2736 ,1/8][3648x2736,1/8]
x
10
x
10
’08. 12.16’08.12.16 2 1:5621:56
100- 0015100-0015 1 515
L
NN
1/25 0 F5.6250 F5.6
+2.0 45mm+2.0 45mm
ISO 1 00ISO 100
0.00.0
A: 0A: 0
WB : AUTOWB : AUTO
G: 0G: 0
NATURALNATURAL
sRGBsRGB
L
NN
SHADOW
HILIGHT
Shadow /
Highlight display
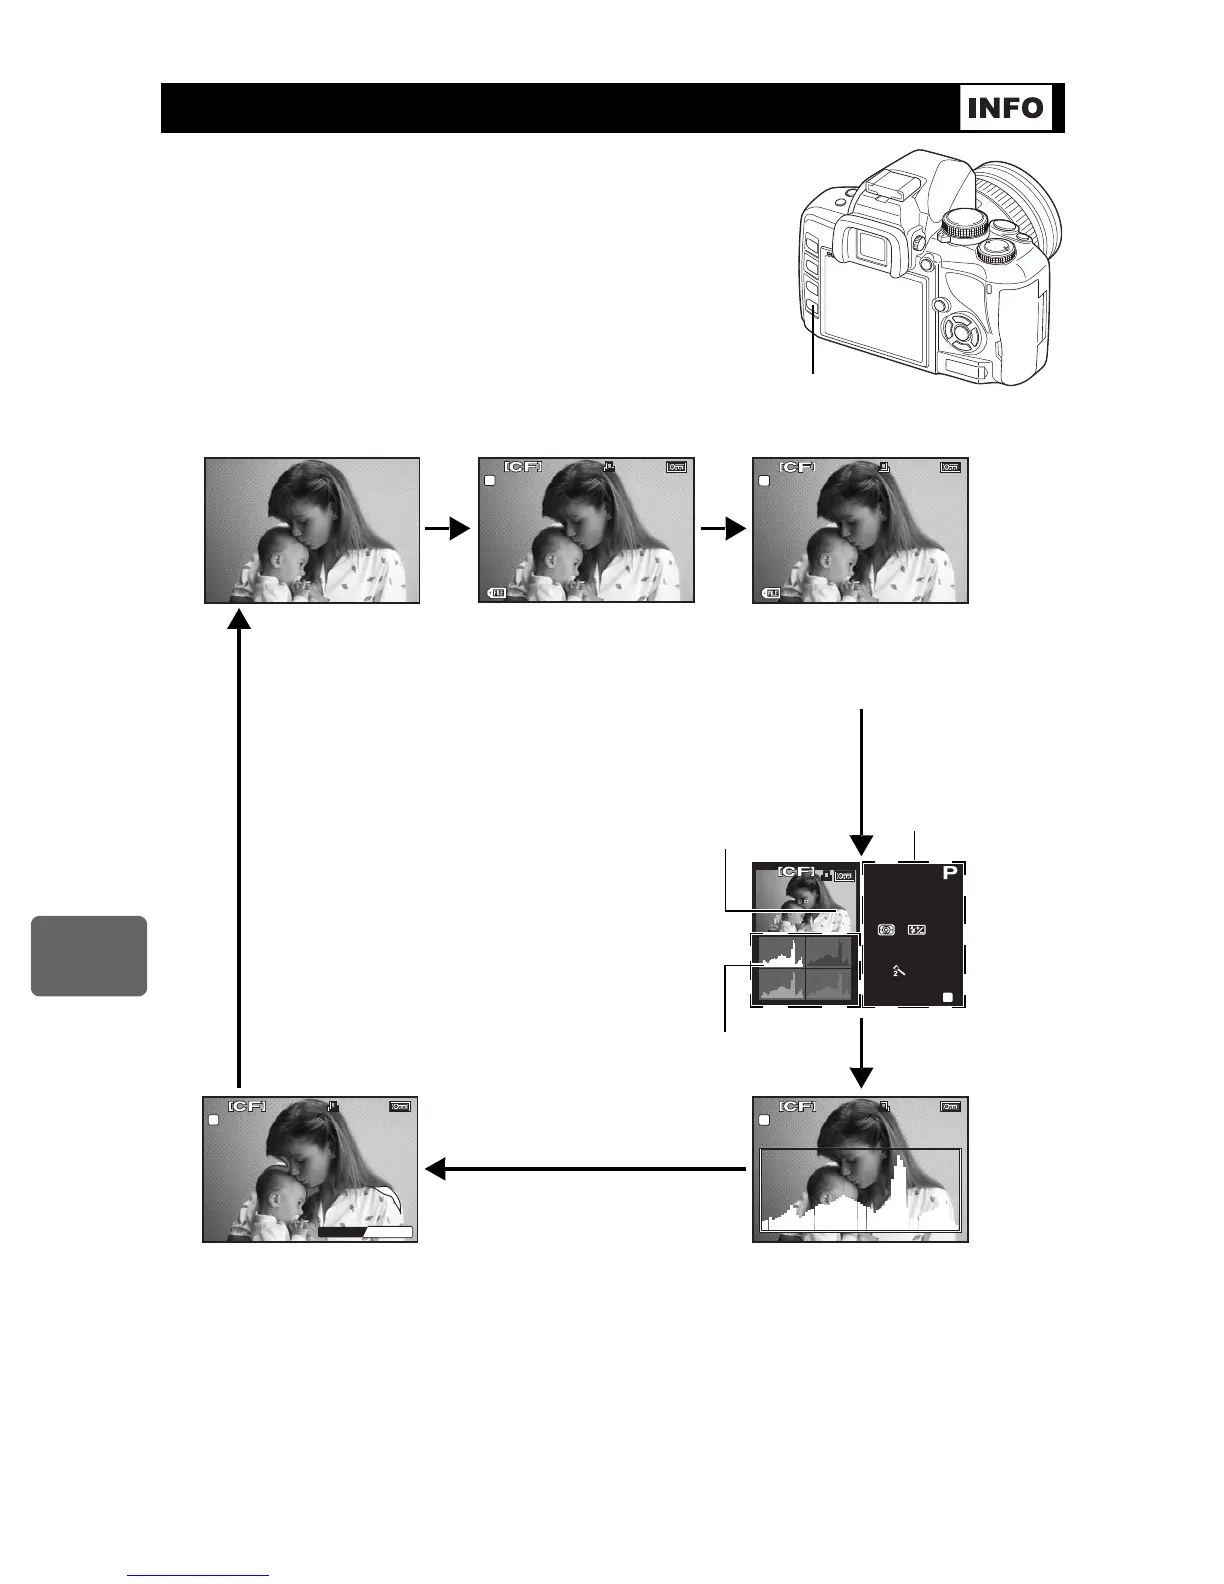
Image only Information 1 Information 2
Shadow / Highlight display Histogram display
Histogram
*
Shooting
information
Displays the frame
number, print reservation,
protect, record mode and
file number.
Displays the frame number, print
reservation, protect, record mode,
number of pixels, compression
rate, date and time and file number.
Distribution of the brightness of the
recorded image is displayed in a
histogram (brightness component
graph).
Under- or overexposed parts of the recorded image are
displayed.
Shadows (underexposed) parts will be shown in blue.
Highlights (overexposed) parts will be shown in red.
*Histogram
If the bars in the histogram are higher on the
right, the image may be too bright. If the bars
are higher on the left, the image may be too
dark. Compensate the exposure or shoot again.
Overall information