Technical Information
ENGLISH -
87
Appendix
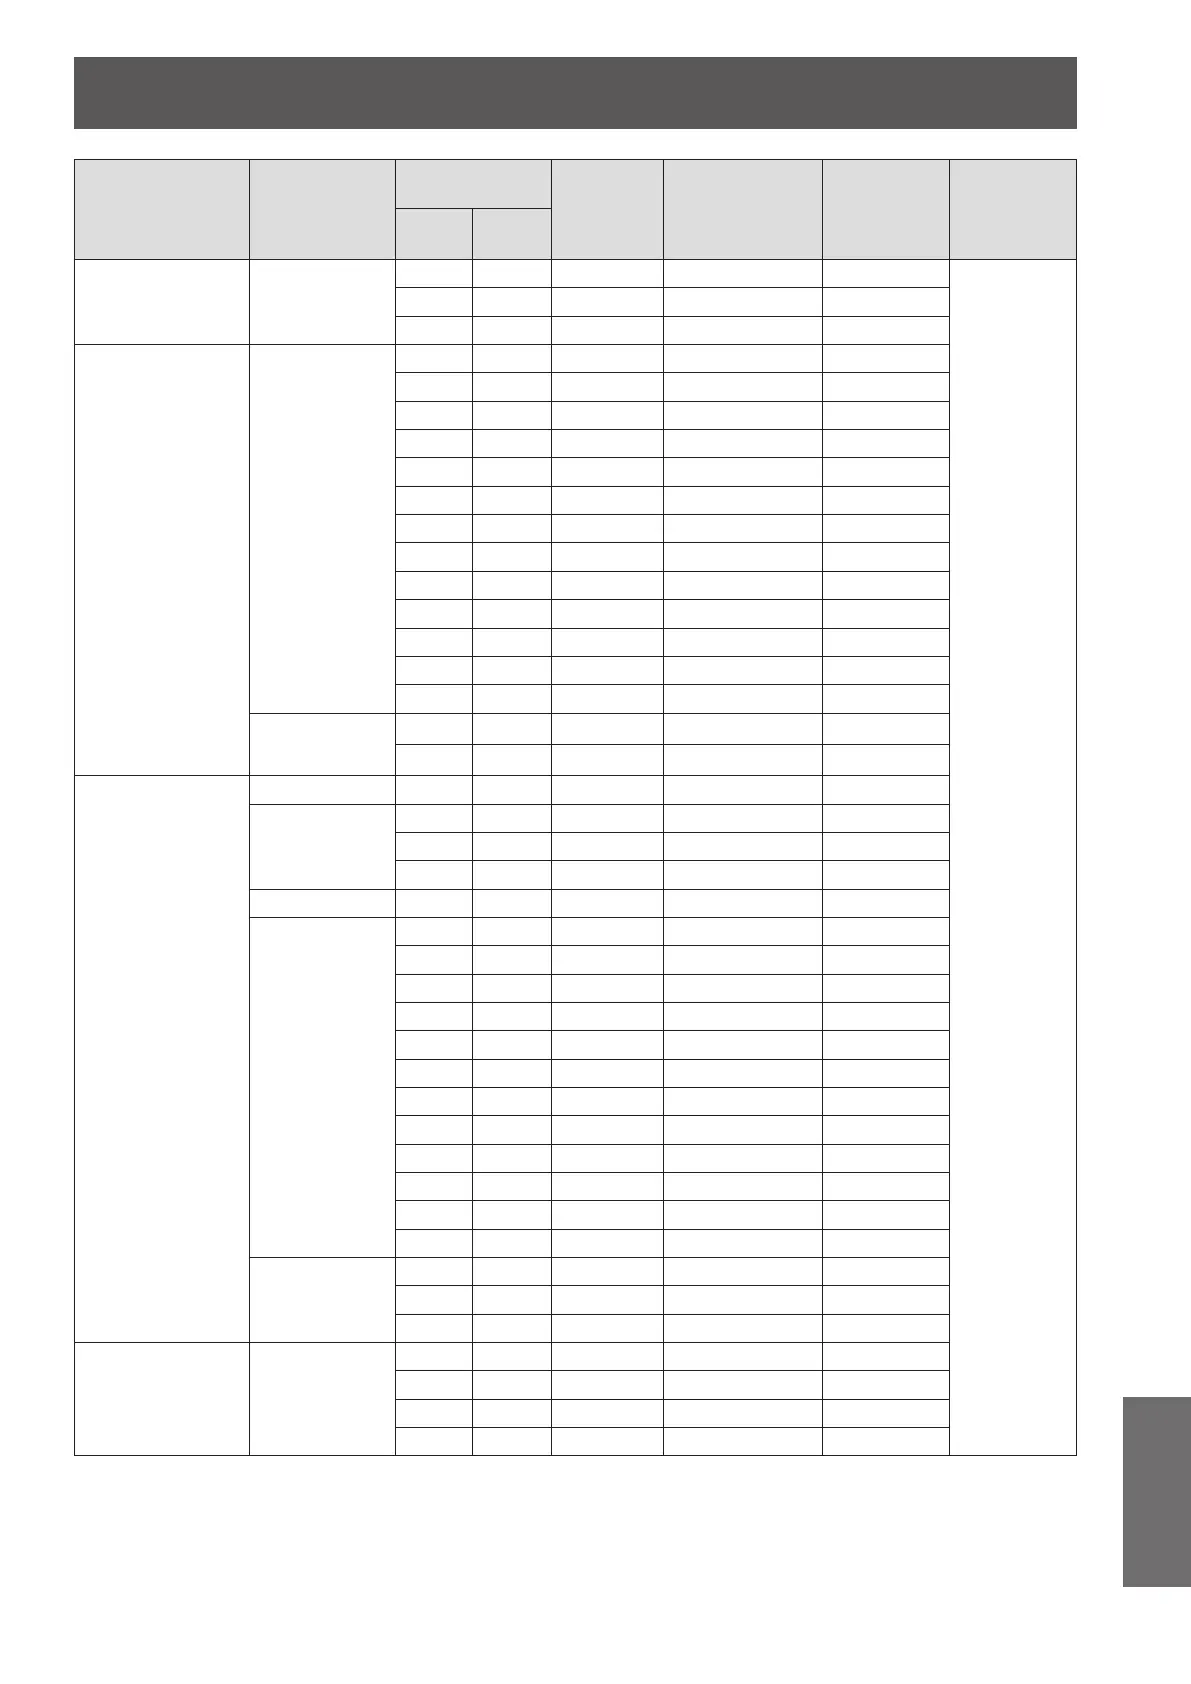
Mode
Display
resolution *
1
(dots)
Scanning
frequency
Dot clock
frequency
(MHz)
Picture
quality *
2
PnP*
3
Format
H (kHz)
V
(Hz)
SXGA+ 1 400 x 1 050
63.970 60.190 107.990 A
C
65.350 60.120 122.850 A
65.120 59.900 122.430 A
XGA
1 024 x 768
48.36 60.00 65.00 AA ○
68.677 84.977 94.504 AA
60.023 75.03 78.75 AA ○
56.476 70.07 75.00 AA ○
60.31 74.92 79.252 AA
48.50 60.02 65.179 AA
44.00 54.58 59.129 AA
63.48 79.35 83.41 AA
62.04 77.07 84.375 AA
61.00 75.70 81.00 AA
46.90 58.20 63.03 AA
47.00 58.30 61.664 AA
58.03 72.00 74.745 AA
1 024 x 768i
36.00 87.17 47.30 AA
35.522 86.96 44.90 AA
SXGA
1 152 x 864 64.20 70.40 94.560 A
1 152 x 900
61.20 65.20 92.00 A
71.40 75.60 105.10 A
61.85 66.00 94.50 A
1 280 x 960 60.00 60.00 108.00 A
1 280 x 1 024
62.50 58.60 108.00 A
63.90 60.00 107.35 A
63.34 59.98 108.18 A
63.74 60.01 109.497 A
71.69 67.19 117.004 A
81.13 76.107 135.008 A
63.98 60.02 108.00 A
79.976 75.025 135.00 A
63.37 60.01 111.520 A
76.97 72.00 130.08 A
63.79 60.18 108.19 A
91.146 85.024 157.5 A
1 280 x 1 024i
50.00 86.00 80.00 A
50.00 94.00 80.00 A
46.43 86.70 78.745 A
UXGA 1 600 x 1 200
75.00 60.00 162.00 A
81.25 65.00 175.50 A
87.5 70.00 189.00 A
93.75 75.00 202.50 A
“i” added to the resolution value indicates an interlaced signal.*1 :
Picture quality is indicated by the following symbols.*2 :
AA: Maximum picture quality can be obtained.
A: Signals are converted by the image processing circuit.
The signal marked with circles (O) can be applied by plug-and-play device.*3 :