2.Selectthetimeperiodthatyouwantthehistorical
datatocover.
HistoricalLaylinescanberesetatanytimeby
selectingResetMin&MaxLaylinesfromthe
LaylinesSet-upmenu.
14.16Polartables
Polarcoordinatetablesforyourvesselcanbe
importedin.csvformat.Thelayoutofthe.csvle
mustadheretothelayoutdetailedbelow.
SpreadsheetprogramssuchasMicrosoftExcelcan
beusedto.csvles.
Thefollowingtablelayoutconstraintsapply:
Column1
•Therstcellisignored
•Column1mustcontaintherelevantTWAangles
•Aminimumof3TWAanglesarerequired
Rows
•Therstcellisignored
•Row1mustcontaintherelevantTWSvaluesin
knots
•Aminimumof3TWSvaluesarerequired
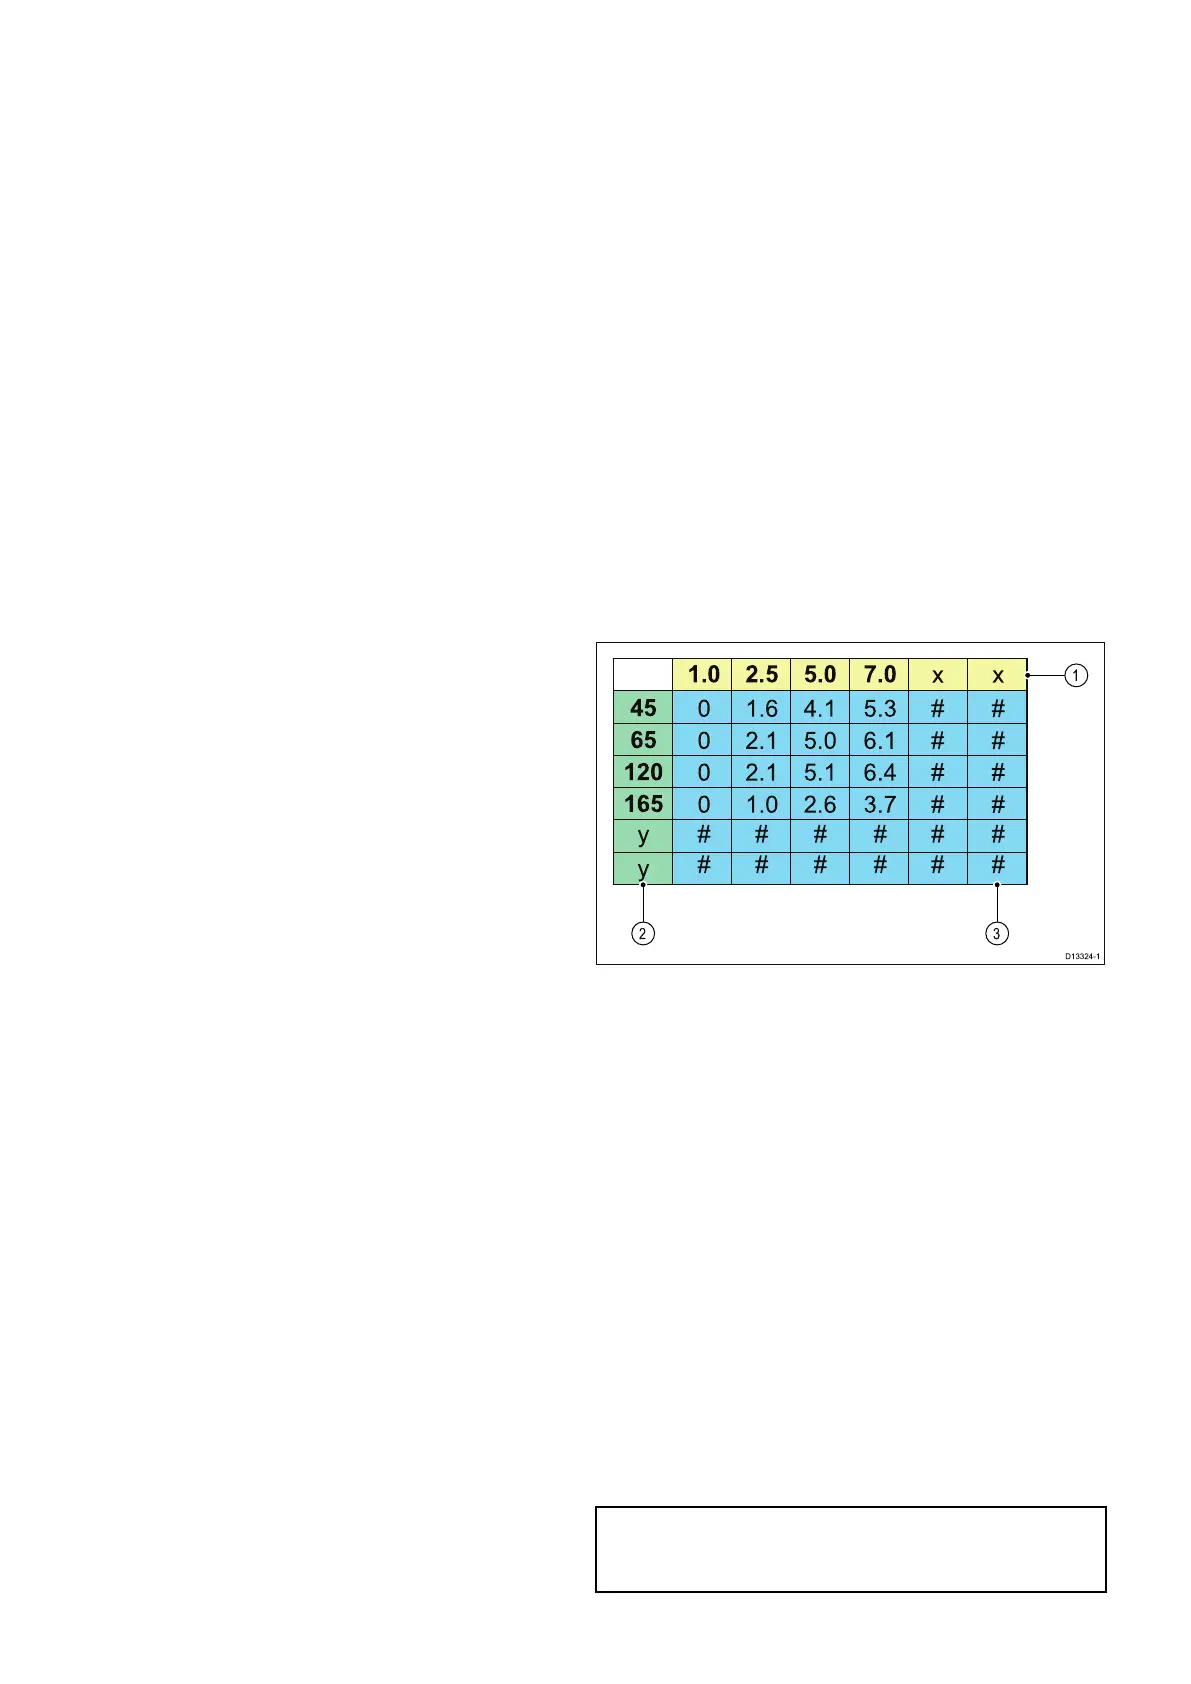
Exampletablelayout
1.0
45
65
120
165
2.5 5.0 7.0
xx
##
##
##
##
##
##
##
##
##
##
y
0 1.6
2.1
4.1
5.0
5.3
6.1
2.1 5.1 6.4
1.0 2.6 3.7
0
0
0
y
D13324-1
2 3
1
1.IncreasingTWSvaluesinknots
2.IncreasingTWAvaluesindegrees
3.T argetvesselspeedvaluesinknots
Importingapolartable
Oncethepolartablehasbeencreatedandsavedas
a.csvleitcanbeimportedintotheMFDusinga
MicroSDcard.
WiththeMicroSDcardcontainingthe.csvle
insertedintoyourMFDscardreader:
FromtheChartapplication’sLaylinesset-upmenu:
Menu>Presentation>Vectors>LaylinesSet-up.
1.SelectImportPolarTable.
2.Browsetothelocationofthe.csvleonyour
MicroSDcardandselectit.
Thepolartablehasnowbeenimportedandthe
PolarsoptionwillbeavailablefromtheLaylines
Typemenu.
Note:ThePolartablecanbedeletedfromthe
systematanytimebyselectingDeletePolartable
fromtheLaylinesSet-upmenu.
188
LightHousemultifunctiondisplayoperationinstructions
 Loading...