Stormtrackingsymbols
Theweatherapplicationusesarangeofsymbolsto
representdifferenttypesofstormtracks.Thestorm
trackingfunctionenablesyoutomonitorsignicant
stormsinthearea.
Examplesofsignicantstormsincludetropical
disturbances,depressions,stormsandcyclones,
hurricanes,typhoons,andsupertyphoons.
Theweathermapdisplaysthetrackthatthestorm
hastaken,itscurrentandforecastedposition,the
windradii(currentpositiononly),direction,and
speedoftravel.
Stormtracksarehighlightedontheweathermapin
theformofsymbols,asshownbelow.
Historical
(grey)
Current
(red)
Forecast
(orange)Description
Hurricane
(Category
1–5)
Tropical
storm
Tropical
disturbance,
tropical
depression
Whenasymbolisselected,additionalstorm
informationcanbeaccessedbythecontextmenu:
•Storm'snameandtype.
•Dateandtime.
•Position,directionandspeed.
•Pressureandmaximumwindspeedandgusts.
Surfacepressuresymbols
Theweatherapplicationusesarangeofsymbolsto
representdifferentsurfacepressureconditions.
SymbolDescription
High/lowpressure(blueand
red)
Warmfront(red)
Coldfront(blue)
Occludedfront(purple)
Stationaryfront(red-blue)
Trough(brown)
Squallline(red)
SymbolDescription
Dryline(red)
Isobars(grey)
Surfaceobservationstationsymbols
Theweatherapplicationusesarangeofsymbols
torepresentdifferenttypesofsurfaceobservation
station.
SymbolDescription
Buoystation
C-MAN(Coastal-marine
automatednetwork)
WSI(Weatherservices
international)
NWS(Nationalweather
service)
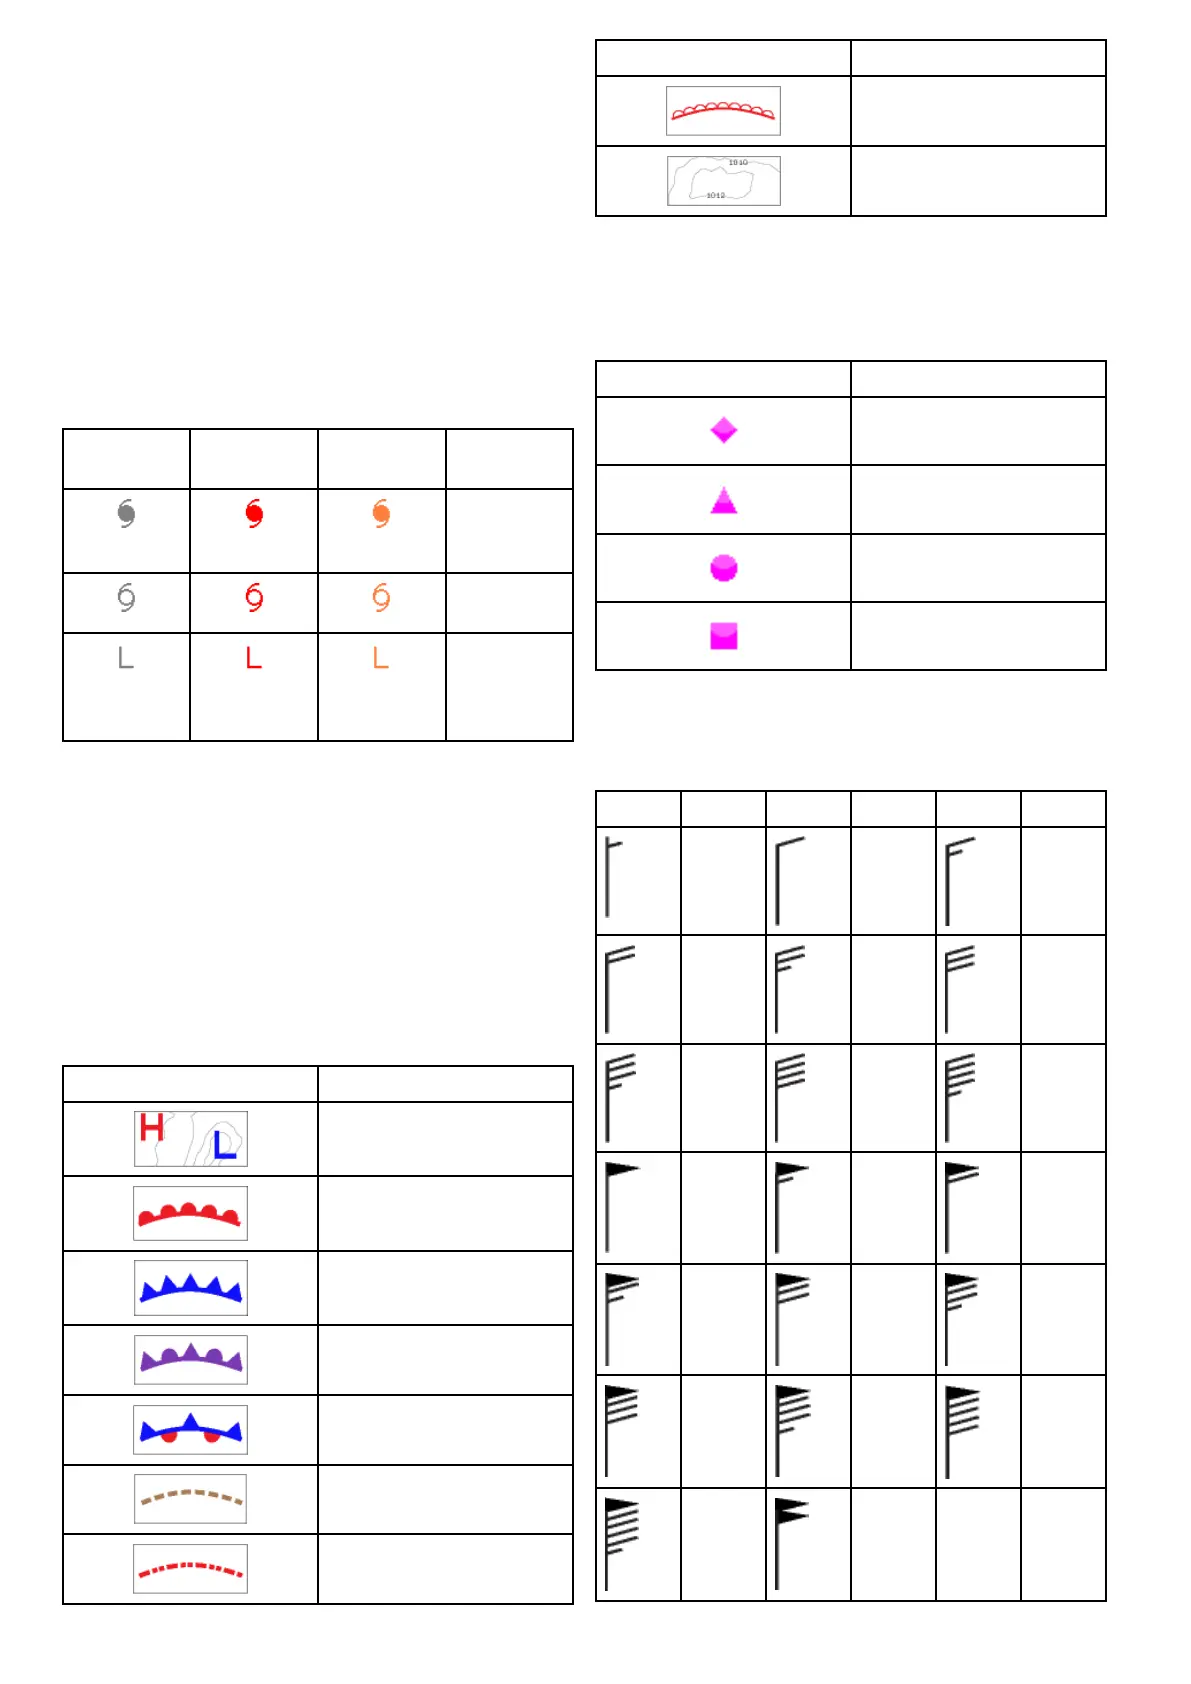
Windspeedsymbols
Theweatherapplicationusesarangeofsymbolsto
representdifferentwindspeeds.
SymbolSpeedSymbolSpeedSymbolSpeed
3–7kts8–12
kts
13–17
kts
18–22
kts
23–27
kts
28–32
kts
33–37
kts
38–42
kts
43–47
kts
48–52
kts
53–57
kts
58–62
kts
63–67
kts
68–72
kts
73–77
kts
78–82
kts
83–87
kts
88–92
kts
93–97
kts
98–102
kts
etc.
320
LightHousemultifunctiondisplayoperationinstructions
 Loading...