16.3Weatherapplicationdisplay
overview
Theweatherapplicationdisplaysarangeofgraphicstoindicate
weatherconditionsandforecastinformation.
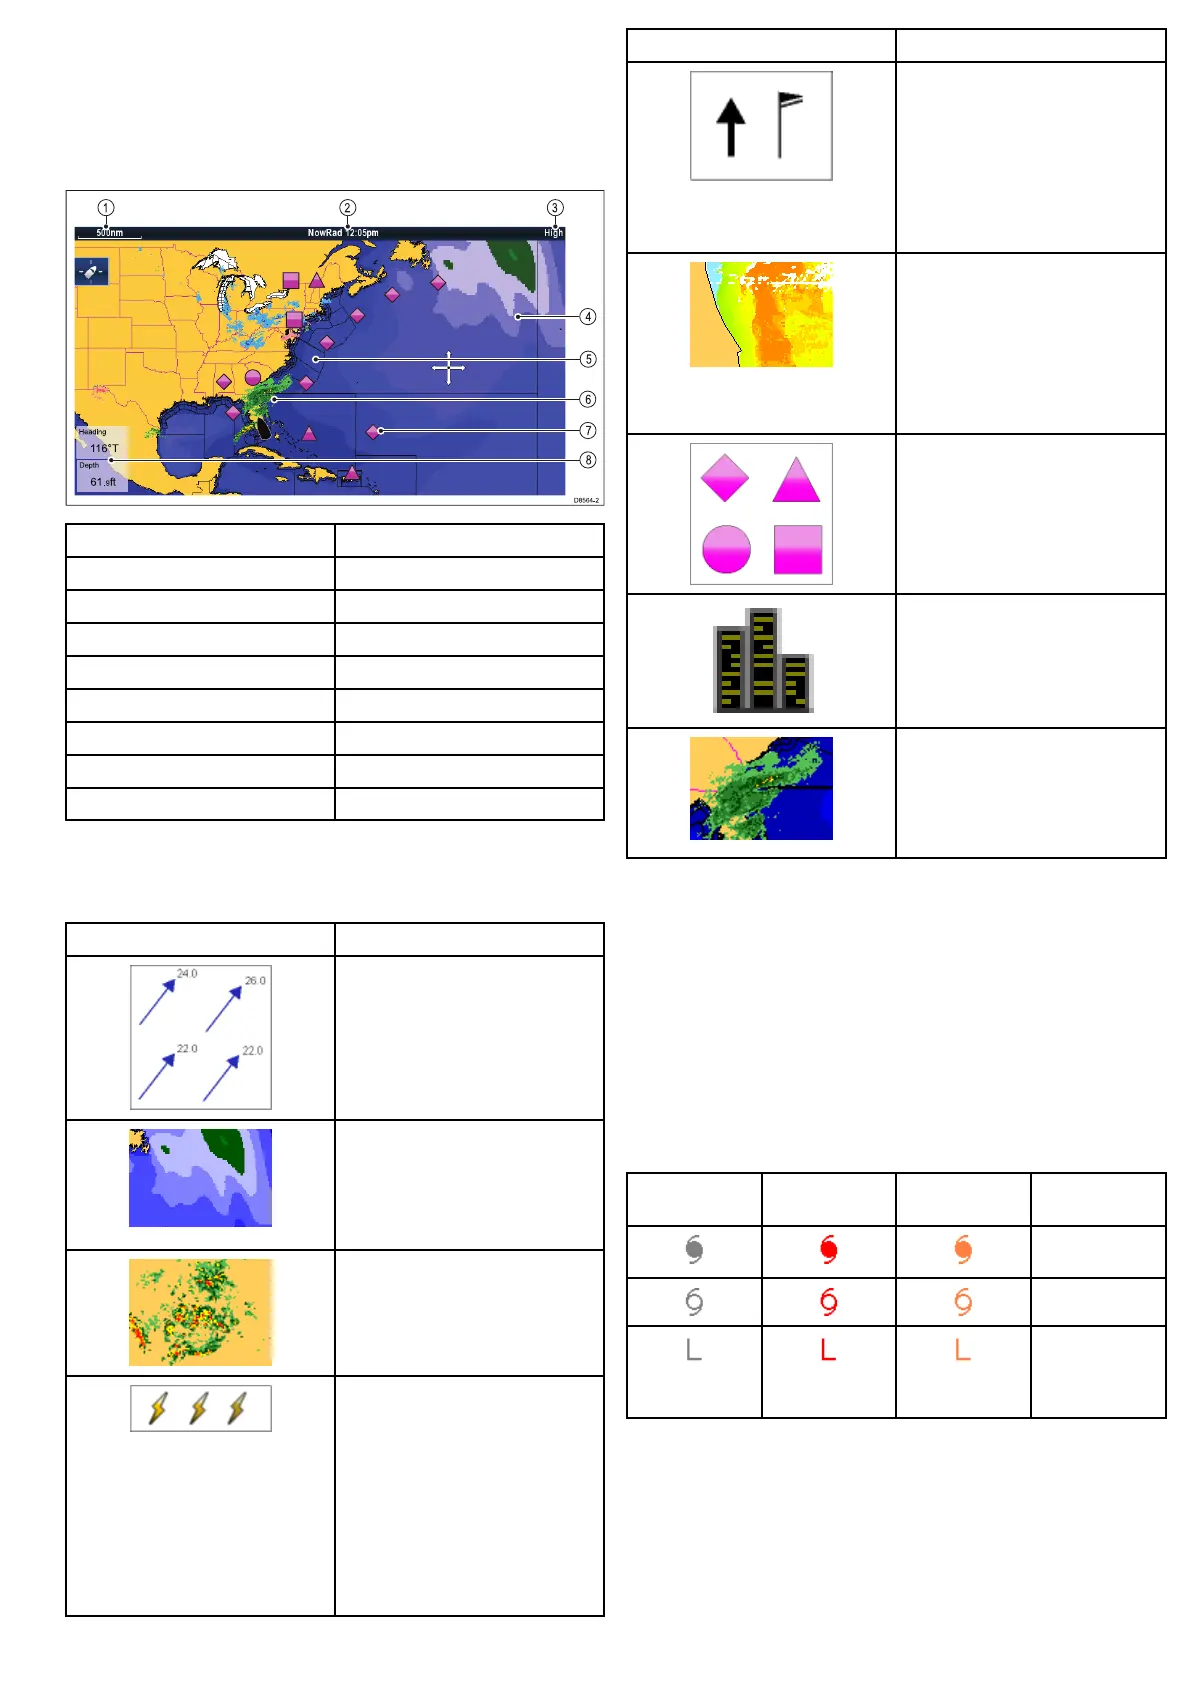
Thefollowingdiagramillustratesthemainfeaturesoftheweather
applicationdisplay:
ItemDescription
1Range
2
Animationandtime/date
3
Signalstrength
4Waveheights
5
Marinezones
6
NOWRad
7
Surfaceobservationstations
8Dataoverlaycells
Weathersymbols
Theweatherapplicationusesarangeofgraphicsandsymbolsto
representdifferentweatherconditionsandforecasts.
SymbolDescription
Stormcast(darkblue)arrows
indicatingdirectionandspeedofa
storm.
Waveheight
•Highestwaves(red)
•Intermediatewaves(greens)
•Lowestwaves(blues)
Canadianradar(darkgreens,yellow,
orangeandred)
Lightning—alightningsymbolis
shownateachcloud-to-groundstrike:
•Light(recordedinlast10–15
minutes.)
•Medium(recordedinlast5–10
minutes.)
•Dark(recordedinlast0–5minutes.)
Morerecentstrikesareoverlaidover
oldersymbols.
SymbolDescription
Wind—Windsymbolsshowthe
currentwinddirectionandstrength
andcanbedisplayedaseitheran
arroworawindbarb.Windarrows
indicatespeed—thelargerthearrow,
thegreater(stronger)thewindspeed.
Windbarbsgiveamoreprecise
indicationofwindspeedasshownin
thewindspeedsymbolssection.
Seasurfacetemperature(green,
yellowandorange)
•Blue—coldest
•green
•yellow
•orangeandred—warmest
Surfaceobservationstations(pink)
—Currentorhistoricalweatherdata
canbeviewedatsurfaceobservation
stations.Notalldataisavailablefor
allstations.
Cities—Thecitysymbolsenables
youtoaccessdetailsofcityweather
forecasts.Upto3forecastsare
displayedforeachcity.
NOWRad
•Rain(green,yellowandred.)
•Snow(blues)
•Mixture(pinks)
Stormtrackingsymbols
Theweatherapplicationusesarangeofsymbolstorepresent
differenttypesofstormtracks.Thestormtrackingfunctionenables
youtomonitorsignicantstormsinthearea.
Examplesofsignicantstormsincludetropicaldisturbances,
depressions,stormsandcyclones,hurricanes,typhoons,andsuper
typhoons.
Theweathermapdisplaysthetrackthatthestormhastaken,its
currentandforecastedposition,thewindradii(currentposition
only),direction,andspeedoftravel.
Stormtracksarehighlightedontheweathermapintheformof
symbols,asshownbelow.
Historical(grey)Current(red)
Forecast
(orange)Description
Hurricane
(Category1–5)
Tropicalstorm
Tropical
disturbance,
tropical
depression
Whenasymbolisselected,additionalstorminformationcanbe
accessedbythecontextmenu:
•Storm’snameandtype.
•Dateandtime.
•Position,directionandspeed.
•Pressureandmaximumwindspeedandgusts.
Usingtheweatherapplication(NorthAmericaonly)
181


 To Next Page