37
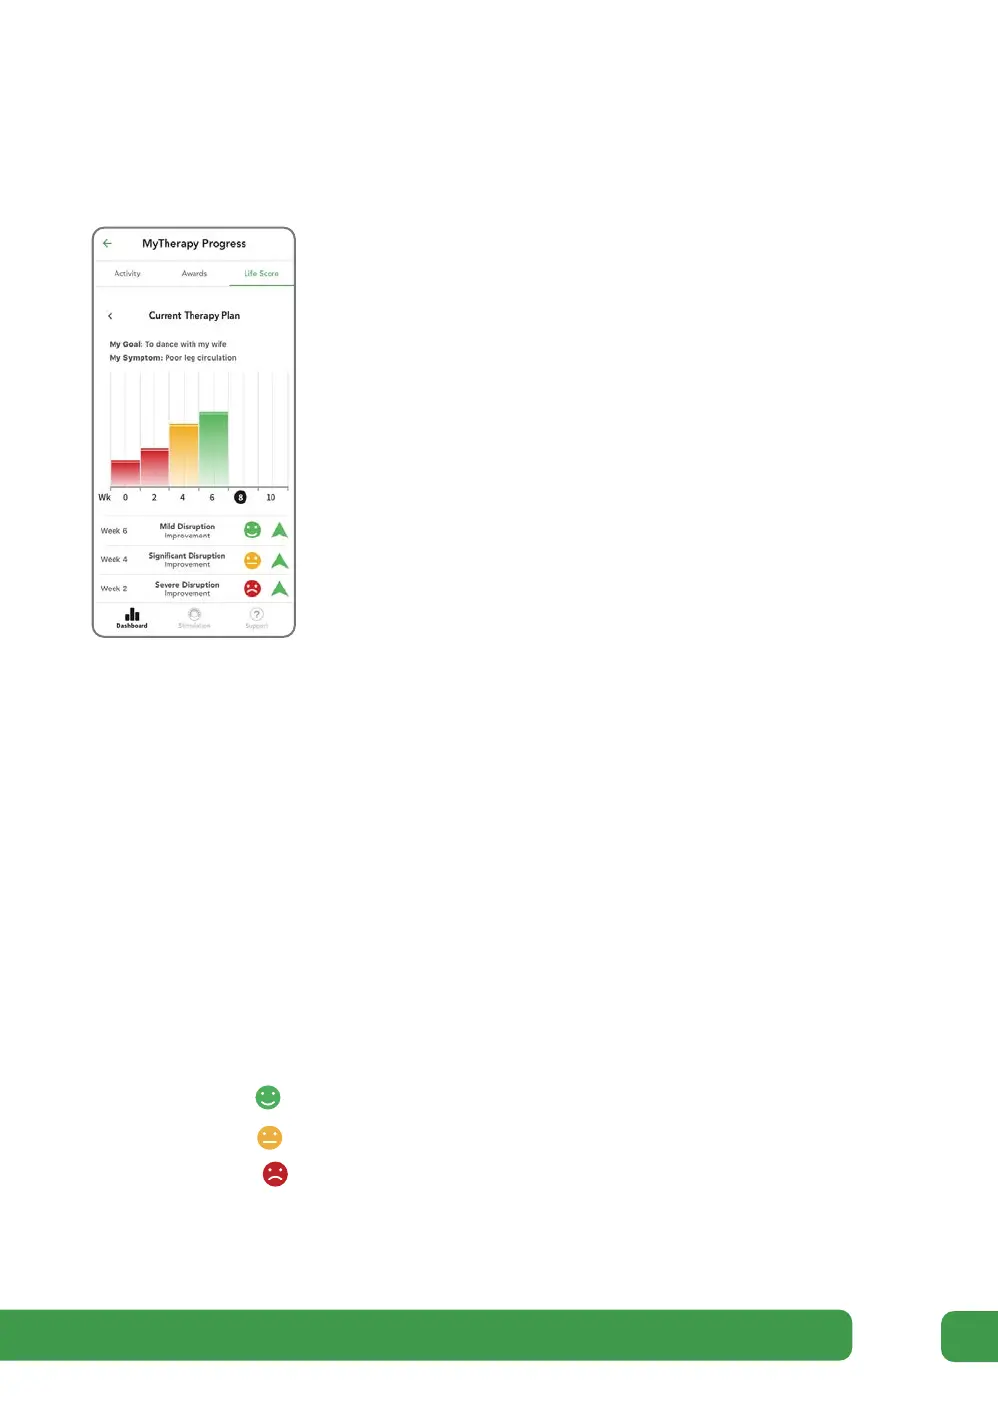
Life Score sub screen
This displays a record of the level of impact your key
symptom has had on your life, as reported by you at the
two-weekly self-assessment points, throughout your
therapy.
Use this to examine how your 10-week suggested Therapy
Plan is alleviating your key symptom.
Self-assessed key symptom impacts (bar graph)
The bar graph displays the ‘impact on your life’ score,
which you assigned to your key symptom during each
2-weekly self-assessment in the selected Therapy Plan.
The highlighted week is the current week.
Red (shortest bars)
You rated your life impact score between 7 and 10
Orange (medium bars)
You rated your life impact score between 4 and 6
Green (tallest bars)
You rated your life impact score between 1 and 3
Changes in key symptom life impact score
Each row indicates the life impact score you gave at each 2-weekly self-assessment
in the Therapy Plan:
Between 1 and 3
Between 4 and 6
Between 7 and 10
Running & monitoring your therapy plan Running & monitoring your therapy plan