20036644
34
Installation
4.14.3 Gas pressure
The Tab. J shows minimum pressure losses along the gas supply
line depending on the maximum burner output operation.
The values shown in the Tab. J refer to natural gas (GCV).
Column 1
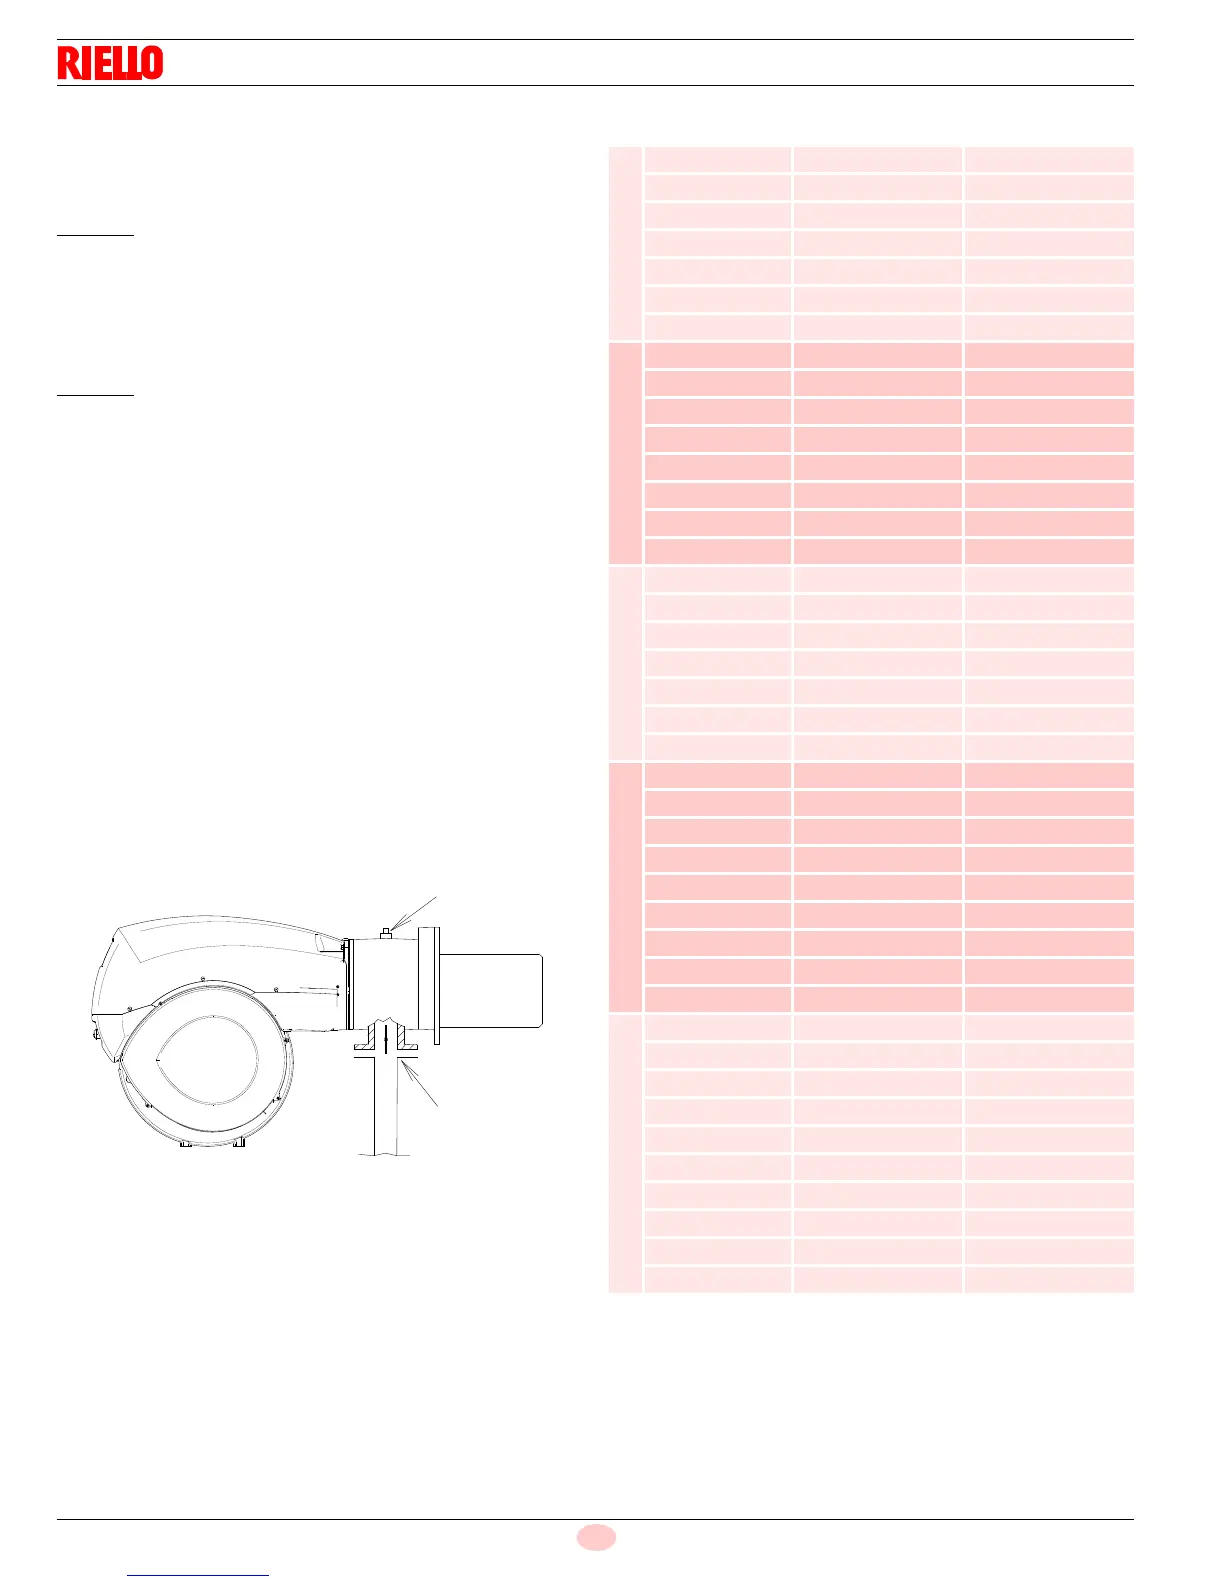
Pressure loss at combustion head.
Gas pressure measured at the test point 1)(Fig. 29), with:
– combustion chamber at “WC;
– burner working at maximum output;
– combustion head adjusted as in the diagram of Fig. 21 on
page 28.
Column 2
Pressure loss at gas butterfly valve 2)(Fig. 29) with maximum
opening: 90°.
Calculate the approximate maximum output of the burner as fol-
lows:
– subtract the combustion chamber pressure from the gas pres-
sure measured at test point 1)(Fig. 29);
– find, in the Tab. J relating to the burner concerned, the pres-
sure value closest to the result of the subtraction;
– read off the corresponding output on the left.
Example for RLS 500/E:
• Maximum output operation
• Gas pressure at test point 1)(Fig. 29) = 11.7 “WC
• Pressure in combustion chamber = 2 “WC
11.7 - 2 = 9.7 “WC
An output of 15148 MBtu/hr shown in Tab. J corresponds to
9.7 “WC pressure, column 1.
This value serves as a rough guide, the effective delivery must be
measured at the gas meter.
Note
See the accompanying instructions for the adjustment of the gas
train.
Tab. J
MBtu/hr (GCV) 1 p (“WC) 2 p (“WC)
RLS 300/E
5112 3.3 0.63
5680 3.7 0.79
7574 4.9 1.38
9467 5.4 2.13
11361 5.9 3
13254 7.9 4.2
14390 9 5.1
RLS 400/E
6816 2.3 1.1
7574 3 1.38
9467 4.7 2.13
11361 6.4 3
12307 7.3 3.62
13254 8.3 5.17
15148 10.8 5.47
17042 13 7
RLS 500/E
9467 4.4 1.81
11361 6 2.64
13254 7.7 3
15148 9.7 3.82
17042 11.8 4.64
18935 14.1 5.55
19692 15 5.9
RLS 650/E
11362 2.8 1
13255 4 1.4
15149 5.1 1.8
17043 6.2 2.2
18936 7.7 2.8
20830 9.3 3.3
22724 10.9 4
24617 12.6 4.7
24805 13.1 4.9
RLS 800/E
13255 4.5 1.1
15149 6 1.4
17043 7.5 1.8
18936 8.9 2.2
20830 10.4 2.6
22724 11.9 3.1
24617 13.9 3.7
26511 15.3 4.3
28405 17.6 4.9
30299 19.9 5.6