70
71
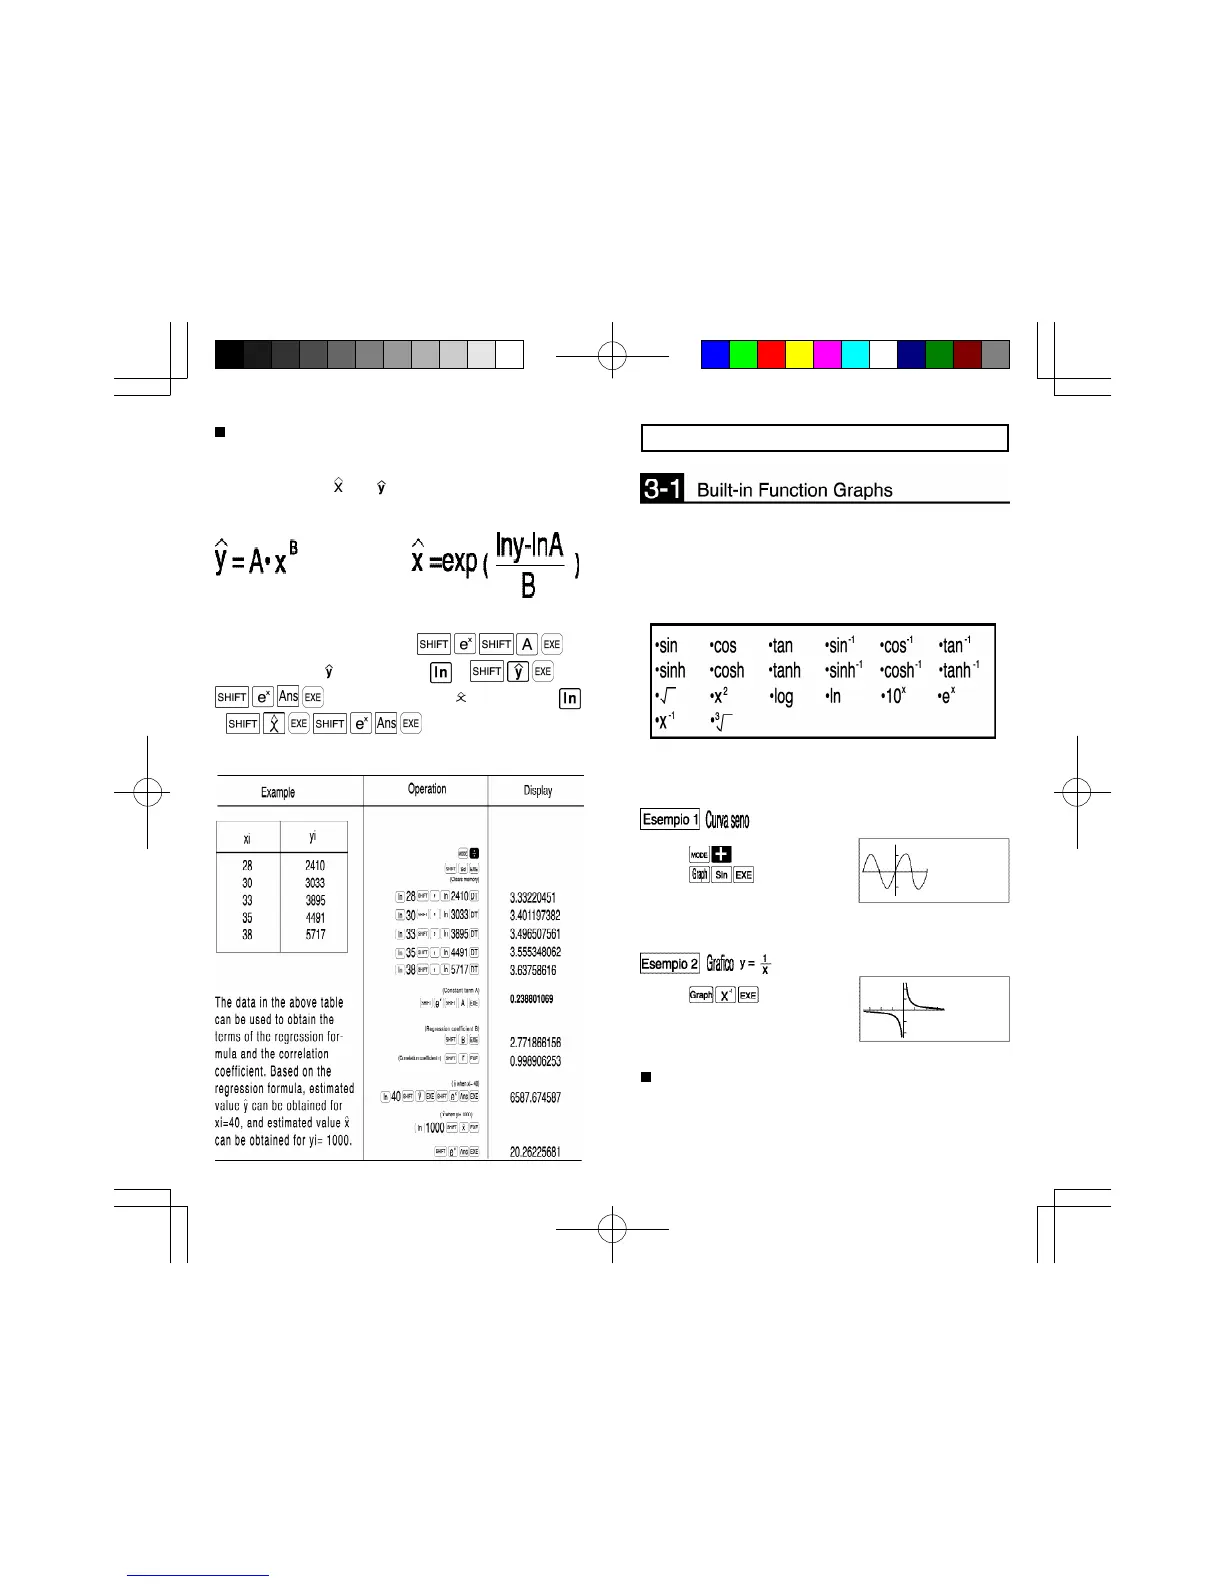
3 Graphs
The COMP mode of the RUN mode should be used when
graphing functions. Some graphs can be produced in the
SD and LR modes, but certain graphs cannot be produced
in these modes. The BASE-N mode cannot be used for
graphs. This unit contains a total of 20 built-in graphs
making it possible to produce the graphs of basic functions.
Any time a built-in graph is executed, the ranges are
automatically set to their optimum values, and any graph
previously on the display is cleared.
Overdrawing built-in function graphs
Two or more different built-in function graphs can be
drawn together on the same display. Since the range for
the first graph is automatically set, all subsequent
graphs on the same display are produced according to
Power regression
• The regression formula is y=A•x
B
(lny=InA + BInx). Enter
both data x and y as logarithms (In).
• Estimated values , and based on the regression
formula can be calculated using the following formulas:
• Correction is performed the same as in linear regression.
Constant term A is obtained by ,
estimated value is obtained by x
and estimated value is obtained by
y ,∑x,∑x
2
, ∑y, ∑y
2
and ∑xy
are obtained by ∑Inx, ∑(Inx)
2
, ∑Iny, ∑ (Iny)
2
and ∑Inx•Iny
respectively.