80
81
• To specify the zoom factors within a program
Use the following formal to specify the zoom factors in a
program.
Factor (Xfactor), (Yfactor)
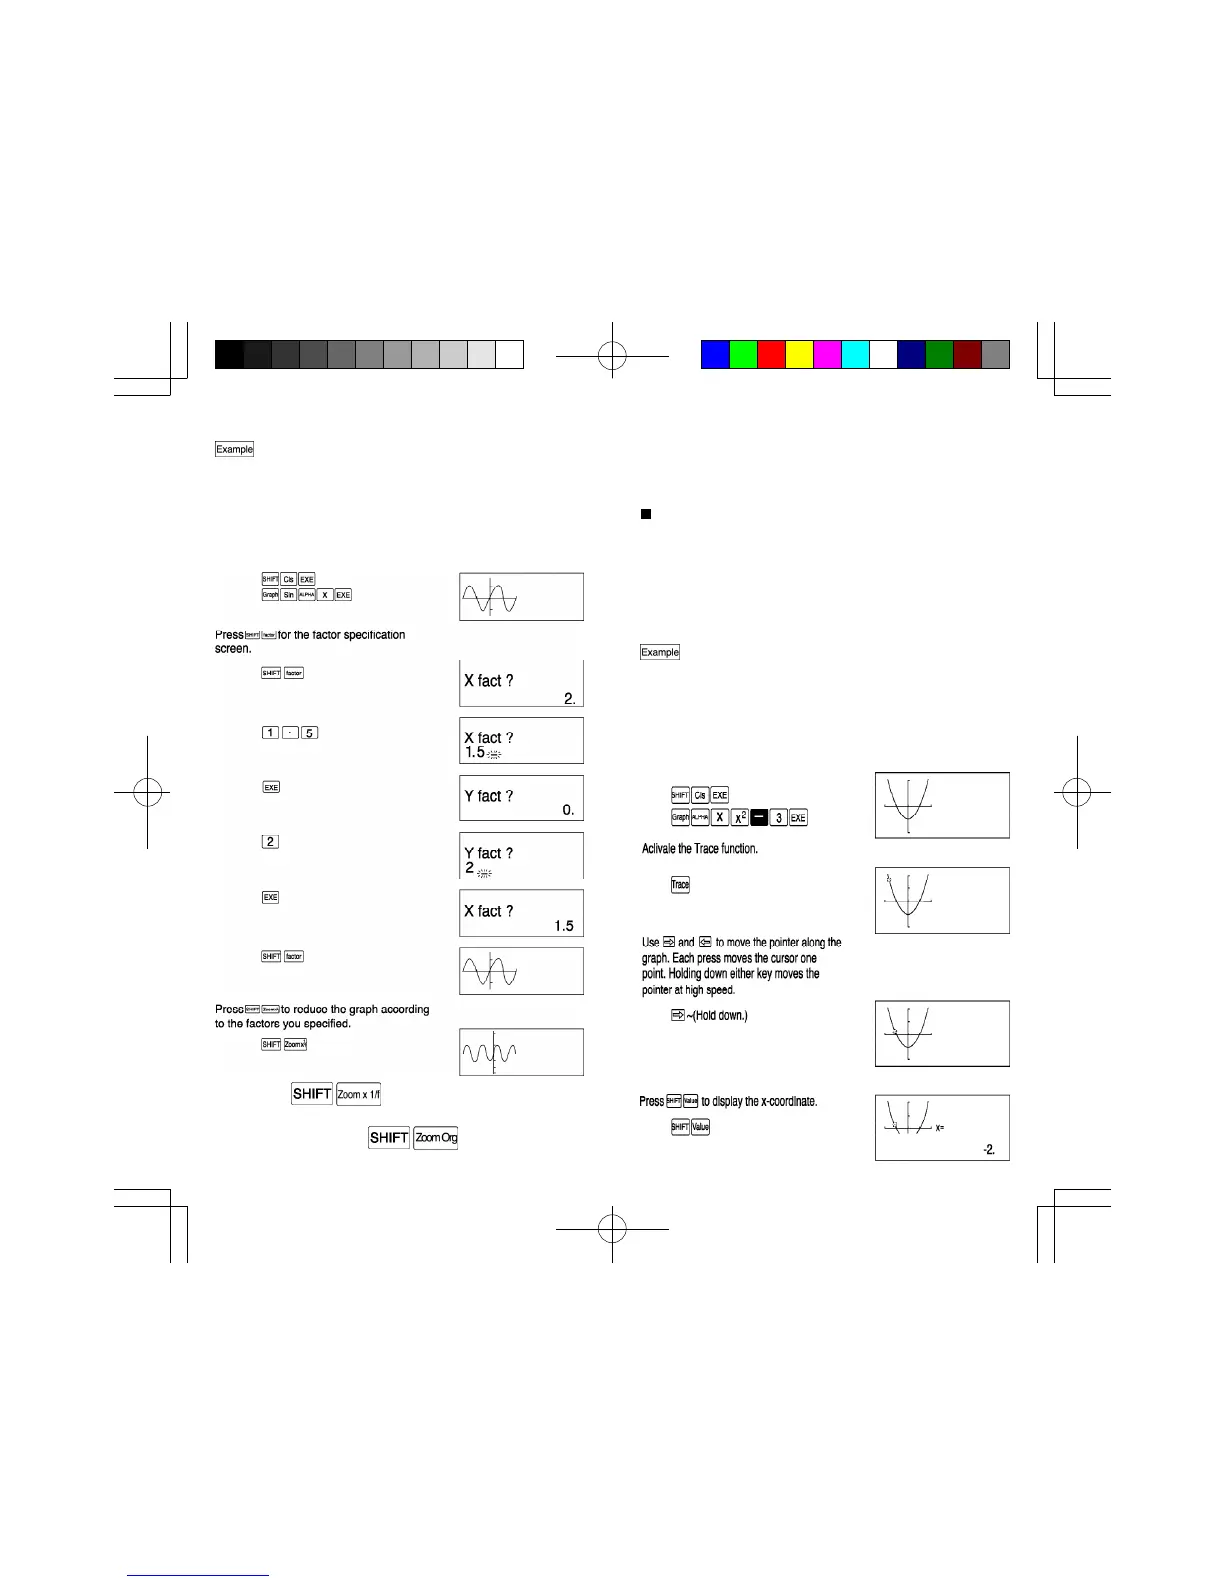
Trace function
This function lets you move a pointer around a graph and
display the x- and y- coordinates of the current pointer
location. You enlarge or reduce the x- and y-coordinates.
You can display the coordinates using either seven digits or
eleven digits (including negative sign).
•Using the trace function
To use the Trace function in combination with the
Zoom function to analyze the graph for y=x
2
-3. Use
the following range parameters for the original graph.
Xmin: -4 Ymin: -8
Xmax: 4 Ymax : 8
Xscl:2 Yscl: 4
After specifying the range parameters, graph y=x
2
-3.
• Reducing a graph
To reduce the graph for y=sinx by a factor of 1.5 on
the x-axis and 2.0 on the y-axis. Use the following
range parameters for the original graph.
Xmin: -360 Ymin: -1.6
Xmax: 360 Ymax : 1.6
Xscl:180 Yscl: 1
After specifying the range parameters, graph y=sinx.
If you press again, the graph is reduced
once more by the factors you specified. To return the graph
to its original size. press .