78
79
* Be sure to input variable X ( ) into the formula
when using built-in graphs for overdraw.
If variable X is not included in the second formula, the
second graph is produced after clearing the first graph.
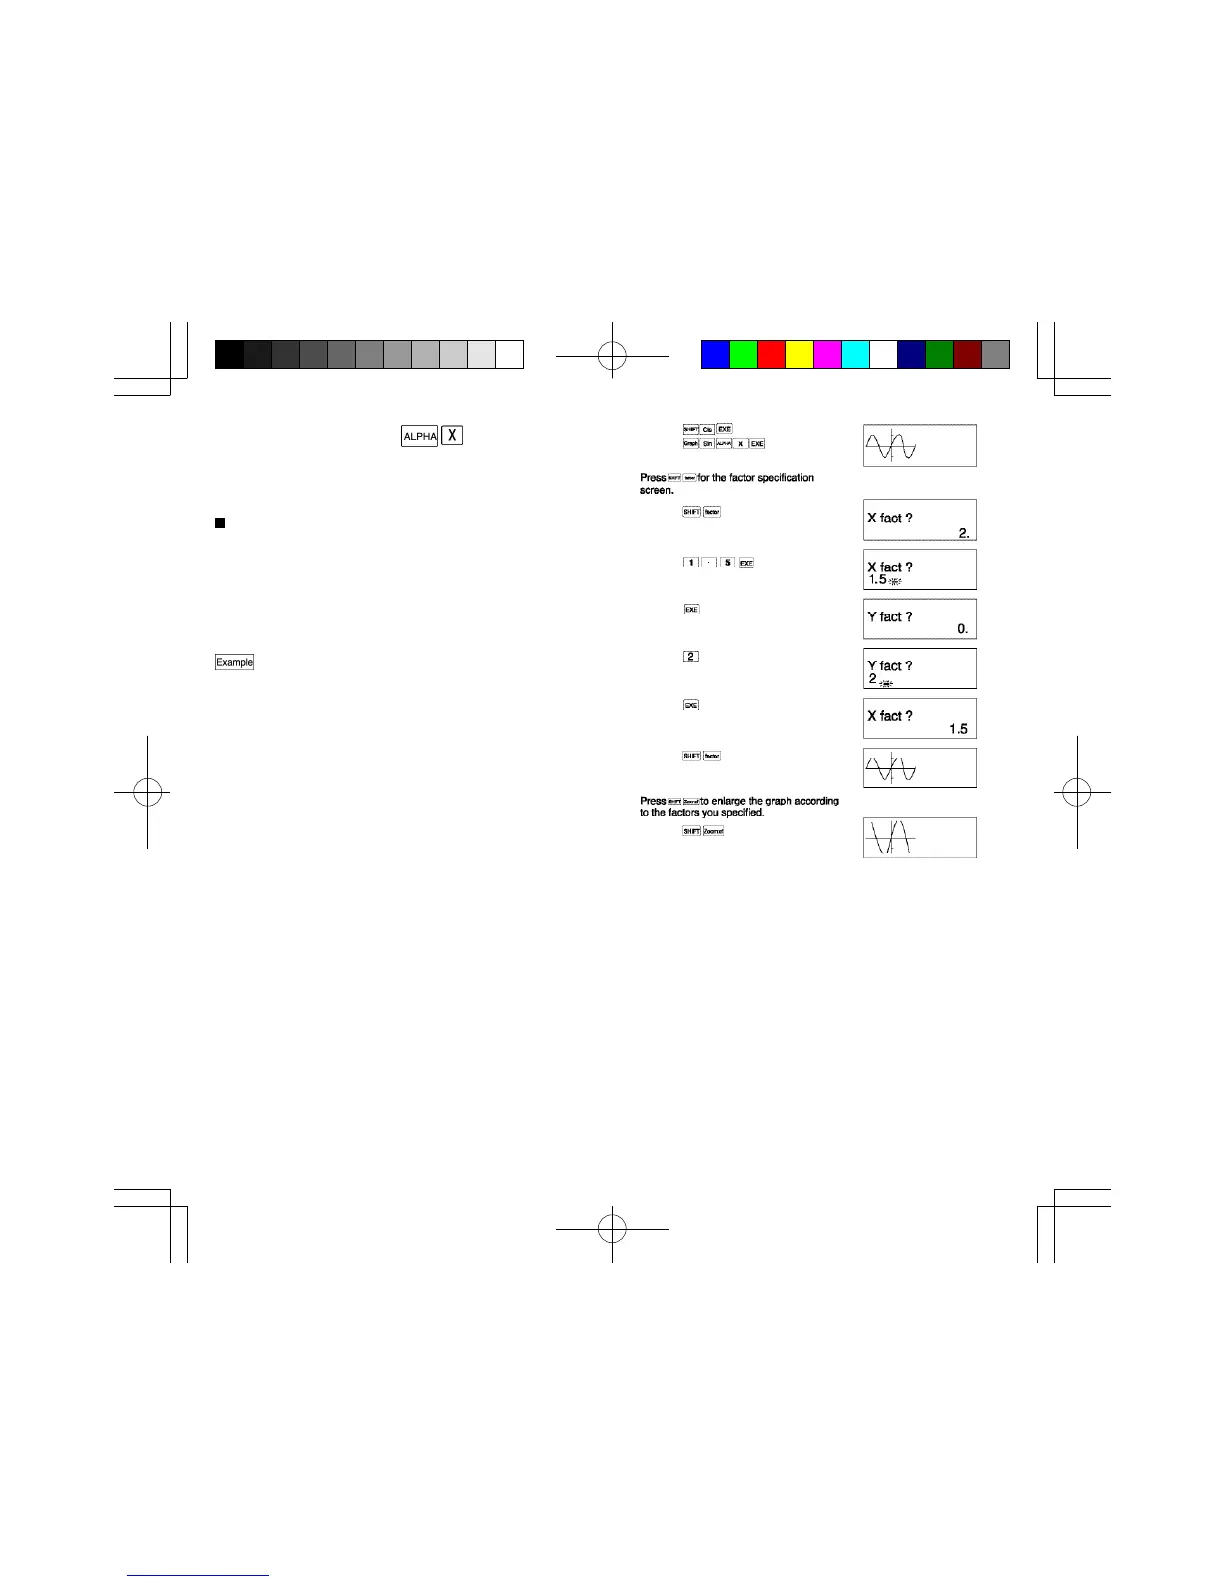
Zoom function
This function lets you enlarge or reduce the x - and
y-coordinates. If you use the Trace or Plot function to
locate the pointer at a specific point on the graph, the
enlargement/reduction is performed using the pointer
location as the center point.
•Enlarging a graph
To enlarge the graph for y=sinx by a factor of 1.5
on the x-axis and 2.0 on the y-axis. Use the following
range parameters for the original graph.
Xmin: -360 Ymin: -1.6
Xmax: 360 Ymax : 1.6
Xscl:180 Yscl: 1