•
RMS values (Index 4538, Write value 1): Limit values for a-RMS and v-RMS are set
for the selected alarm axis.
•
Non-RMS values (Index 4538, Write value 2) limit values for Variance, Skewness,
Kurtosis, Peak to peak, Shape factor, Crest factor, Impulse factor are set for the selected
alarm axis.
•
All values (Index 4538, Write value 3): All limit values for time range indication
values are set for the selected alarm axis.
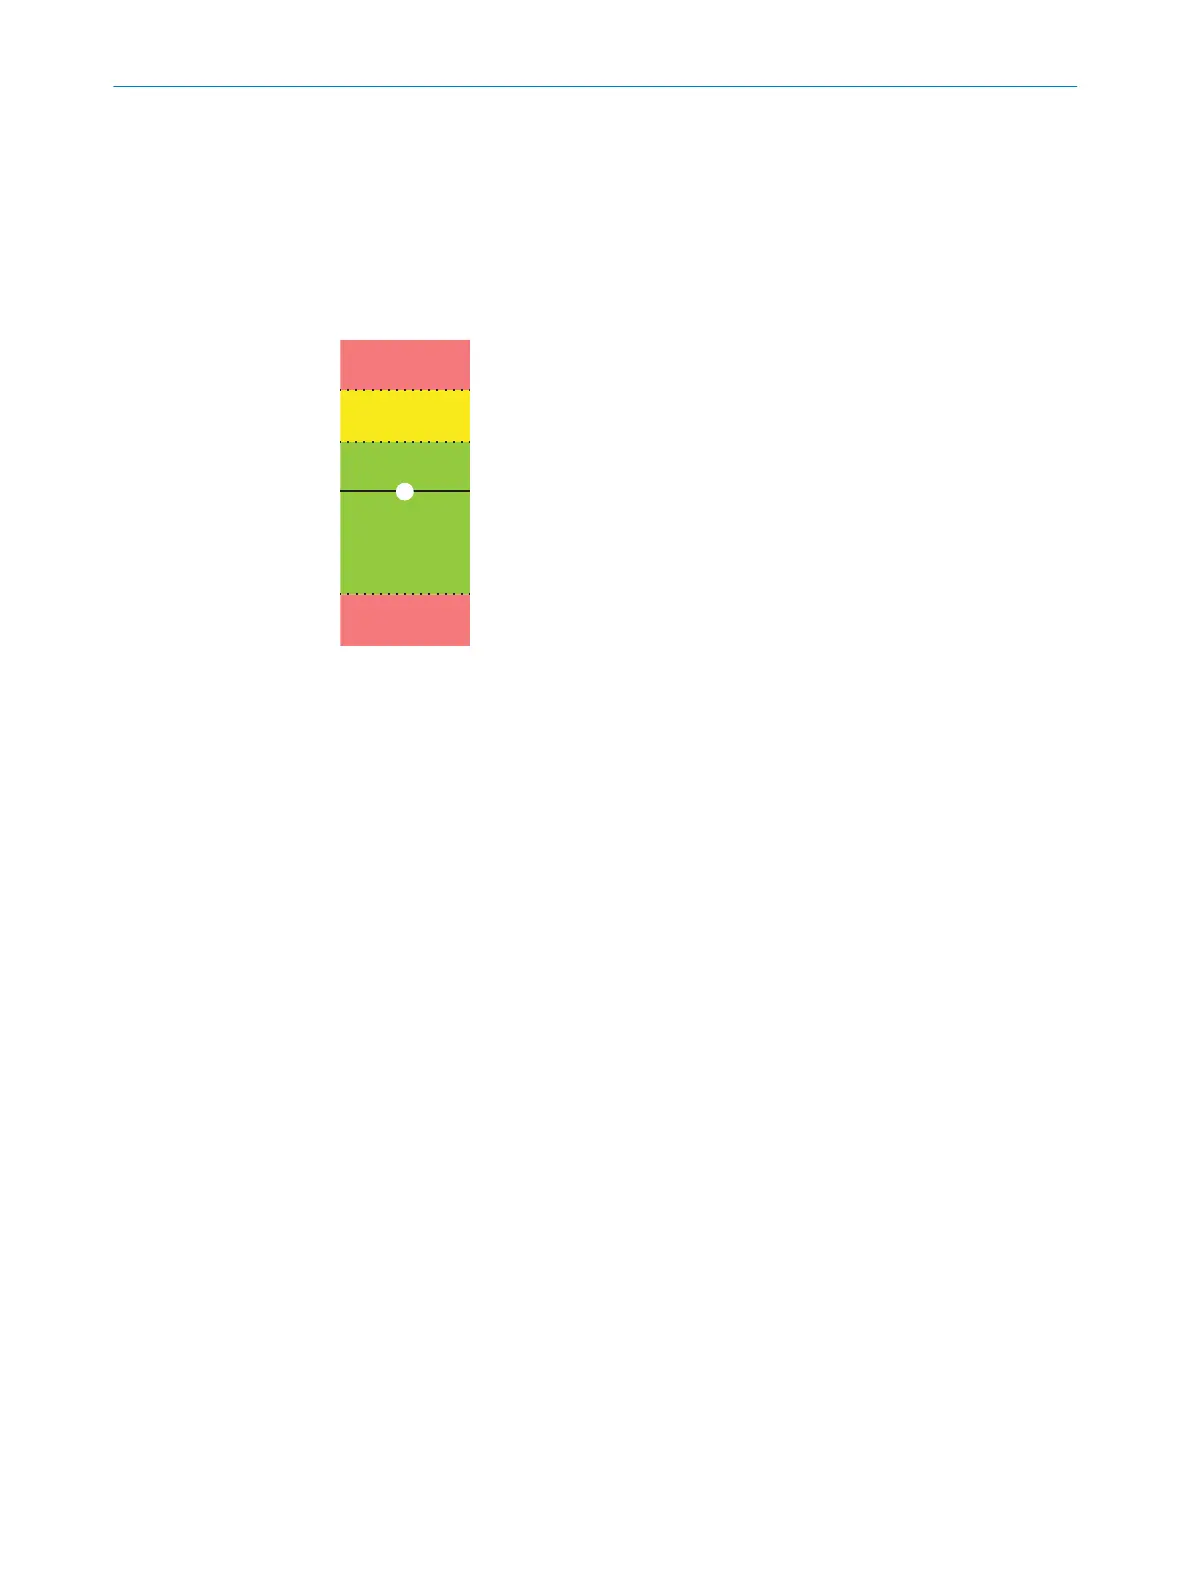
Automatic setting of the limit values is done as shown in figure 17:
Figure 17: Limit values of teach-in process
1
Maximum limit value: approx. 25% above the current value
2
Pre-maximum: only for a-RMS and v-RMS:
Approx.15% above the current value
3
Current value
4
Minimum limit value: approx. 25% below the current value
At the start of the teach-in process, the mean value and standard deviation of the
subsequent 10 blocks are considered so that outliers in the limit setting are not as
significant.
The progress of the teach-in process can be read out via Index 4539.
9.3.2 Monitoring in frequency range (Index 4549-4582)
In addition to the characteristic values in the time range, the determination of market
position also monitors the vibration on a single axis (section 4.3.6) in the frequency
range. It is not the complete spectrum that is considered, but rather the maxima
(peaks) in the spectrum that reflect the essential frequency components of the vibra‐
tion. The sensor provides information on the current amplitude [g or mm/s] and fre‐
quency [Hz] of the 16 peaks with the highest amplitude. Here, only frequencies whose
amplitudes lie above the noise are considered.
The amplitude is output depending on the defined signal type (see "Settings for vibra‐
tion analysis (Index 4477, 4479, 4482, 4531)", page 12) in acceleration or speed.
9.3.2.1 Reduced analysis
To get a quick overview, the peak with the highest amplitude and the peak with the
lowest frequency can be monitored separately in the reduced analysis:
•
Dominant peak (Index 4549 - 4551)
°
Peak with the highest amplitude
°
This frequency has the highest amplitude in the overall vibration.
OPERATION 9
8028041/2022-08-16 | SICK O P E R A T I N G I N S T R U C T I O N S | MPB10
35
Subject to change without notice