9 eSieFusion Imaging
Instructions for Use 9 - 9
eSieFusion Navigator
The Navigator lists all planning data and alignments created for the displayed image. Planning
data includes landmarks, segmentations, and needle paths. Each time you create planning
data, the system displays a unique marker on the image and updates the Navigator with a
corresponding entry. The color of the on-screen marker matches the color of the entry marker
in the Navigator.
Note: Alignments do not display a corresponding on-screen marker.
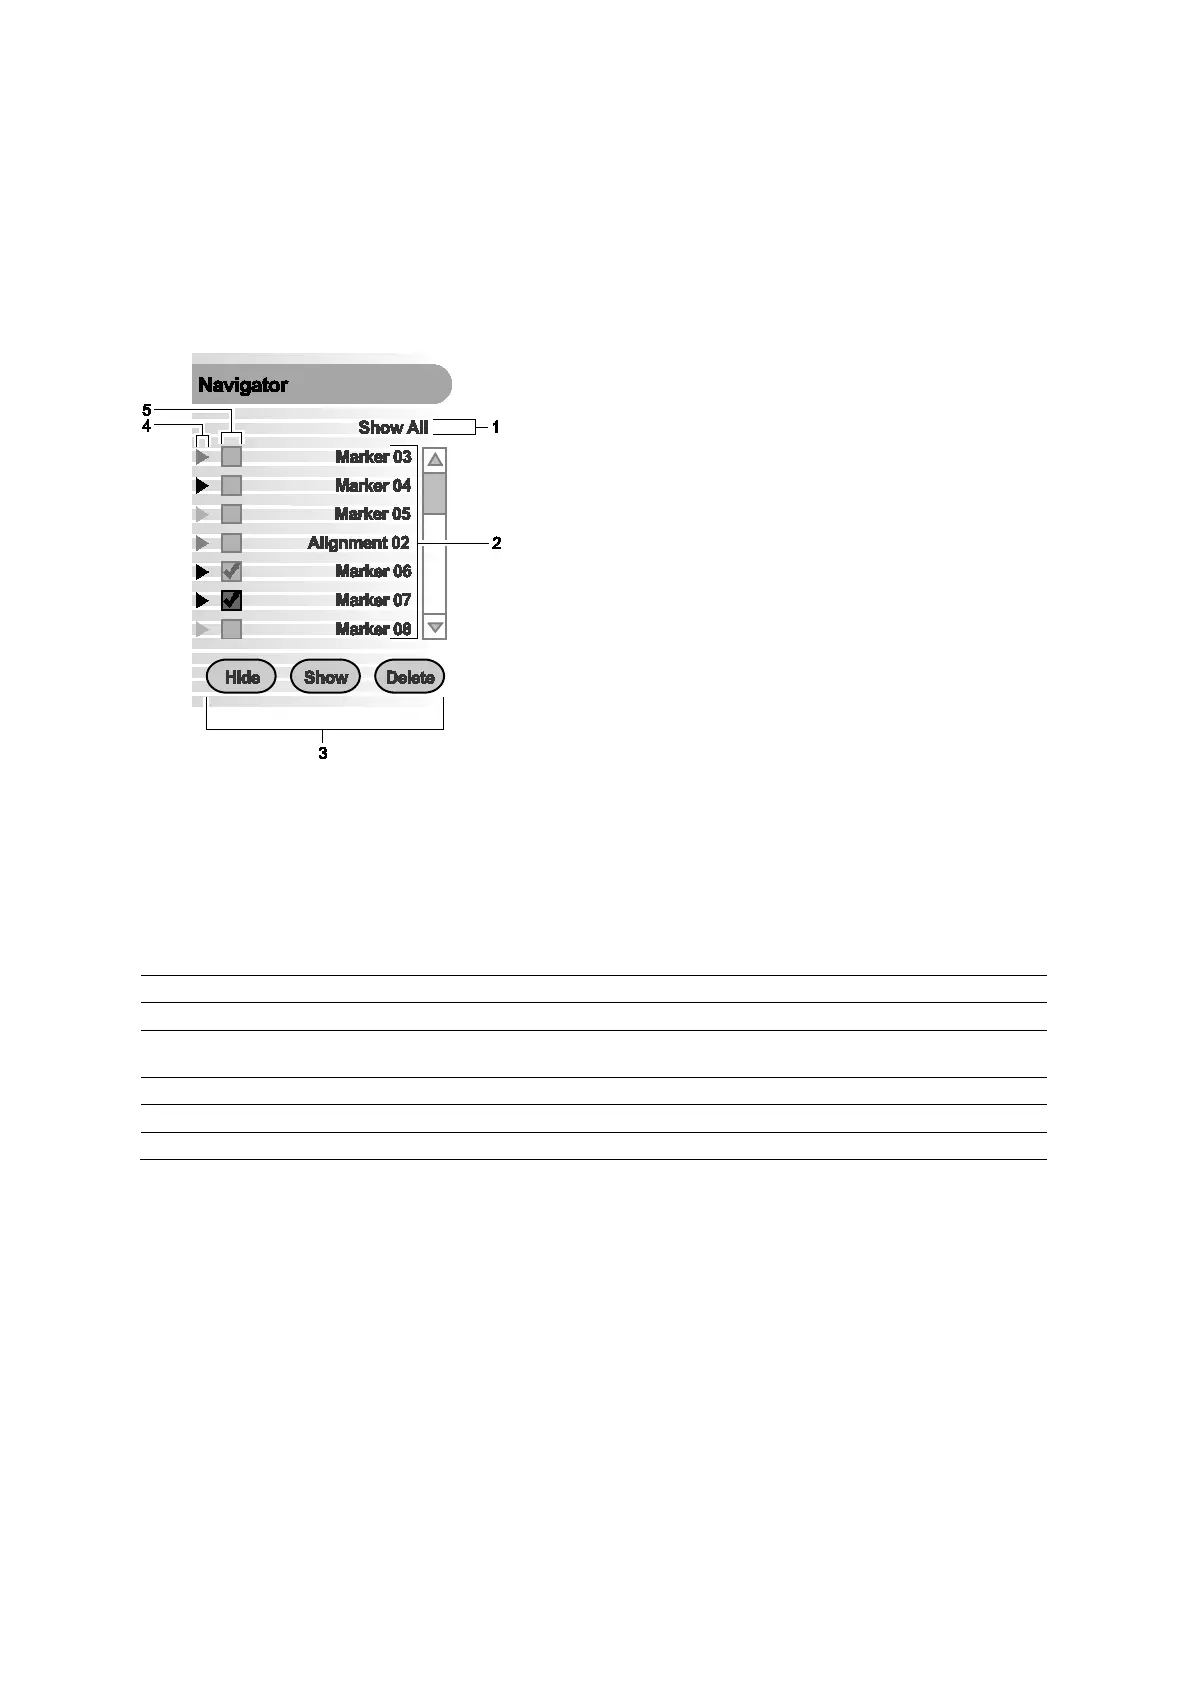
Example of eSieFusion Navigator.
1 Menu to limit the list of entries displayed in the Navigator
2 List of entries
3 Controls to display, hide, or delete planning data or alignments on the image
4 Entry marker
5 Check boxes to select the entries to hide, display, or delete
eSieFusion Navigator Controls
Type of Planning Data Example of Navigator Label Example Marker on the Image
Pair of corresponding points (identified using the
point alignment method)
Pair Markers 03 PtC03
Needle path guideline Needle Path 01 Pink outline
Segmentation (outline of an area of interest)
Segmentation dots or outline
Alignment
---
 Loading...