October 21
st
, 2021 32
PV Graphical View
A. Displays power production over time for the PV array
B. Use up/down buttons to navigate between days
C. Month view, Year view, and Total view
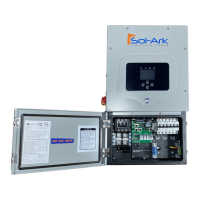
Grid Graphical View
A. Displays power drawn from and sold to the grid over time
B. Bars above the line indicate power bought from the grid
C. Bars below the line indicate power sold back to the grid
This view can help determine when the peak power is used in the Home and for Time of Use programing
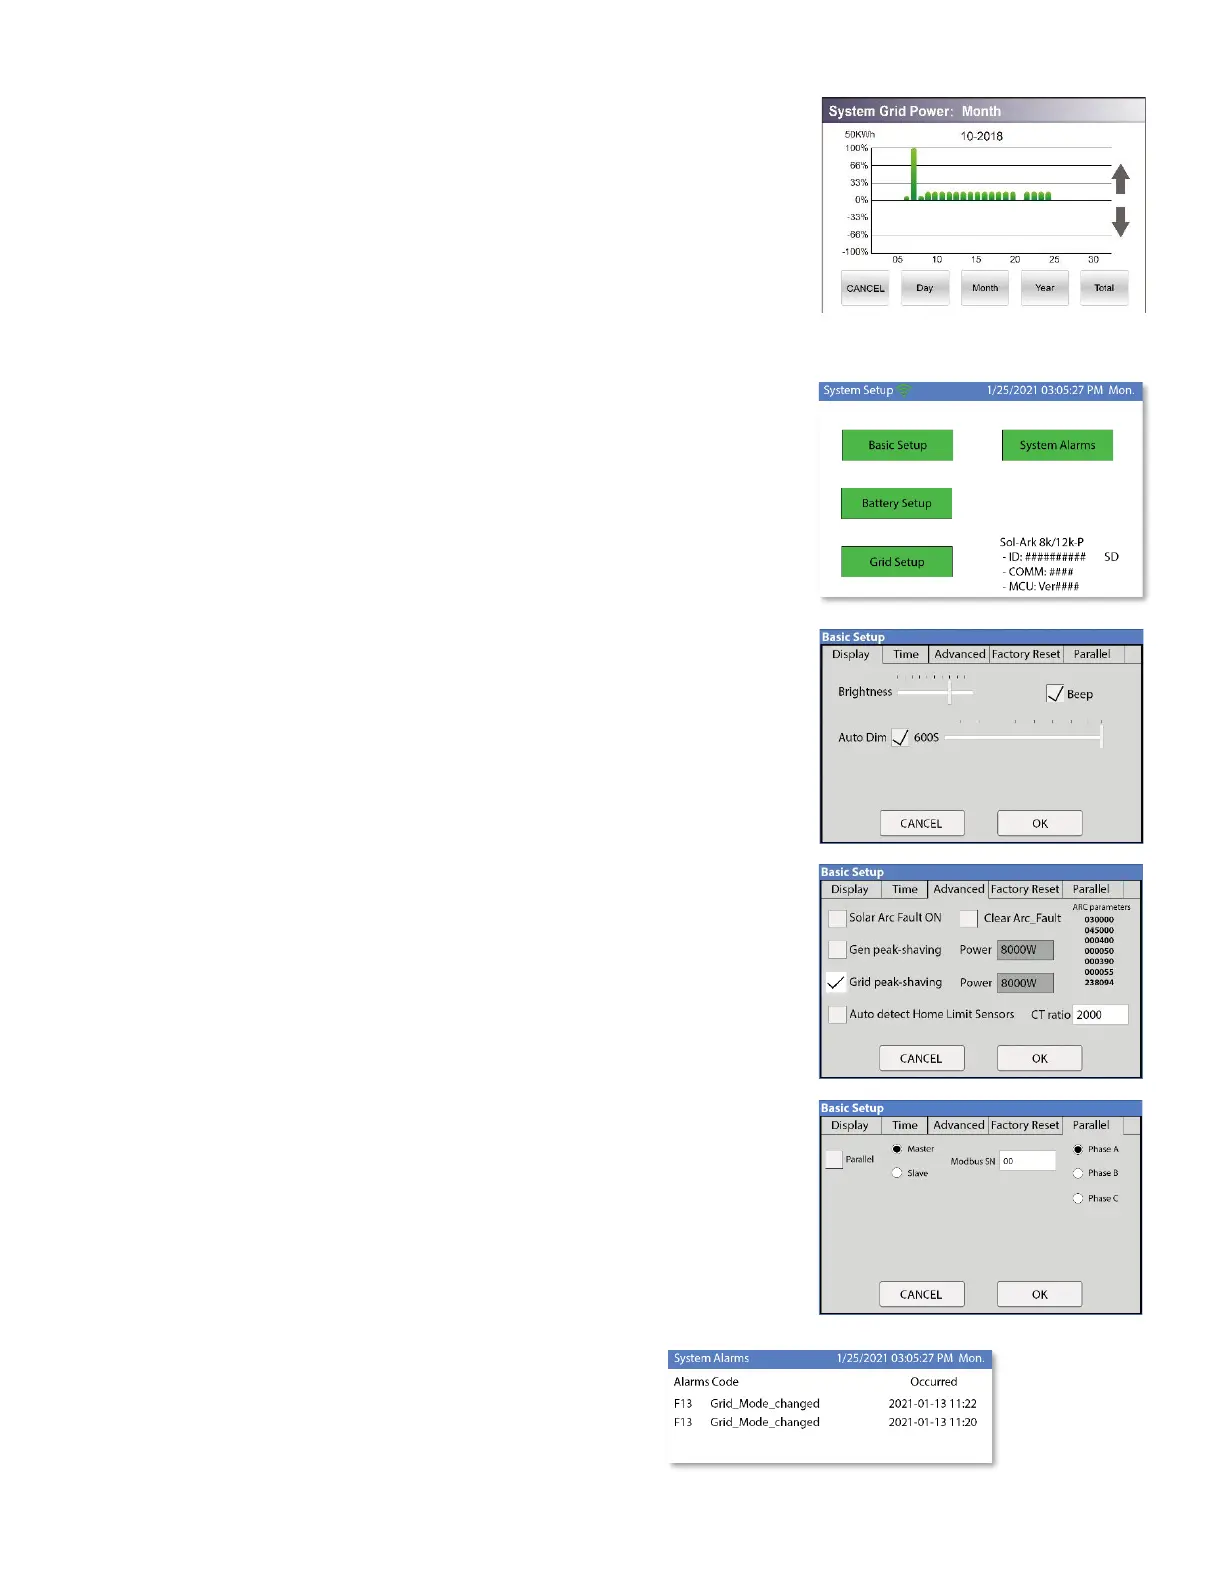
System Setup Menu
A. ID = LCD serial #. Support uses the Wi-Fi serial #.
B. COMM = LCD software version
C. MCU = Inverter software version
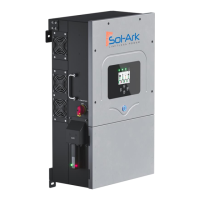
Basic Setup
Display
A. Brightness adjustment
B. Auto dim (must be enabled for the warranty to cover LCD screen)
C. Enable/disable BEEP
Time
A. Set date and time for the system
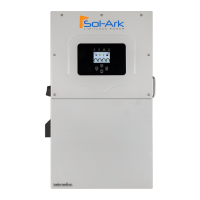
B. Alarms & Safety
C. Arc fault detects if a poor connection in the PV wires
Grid Peak Shaving
Set the Sol-Ark's threshold to begin contributing power to keep the power drawn
from the grid below the threshold.
Gen Peak Shaving
Set the threshold at which the Sol-Ark will contribute to the generator to prevent
large loads overloading the generator.
Parallel (connecting multiple systems)
A. Select parallel mode when using more than one system
B. Set the Master/Slave status of each system
i. Label only one system as the "Master"
C. Set the MODBUS address of each system starting at 01
D. When using multiple Systems in 120/208V mode, select which phase
each system is responsible for (A, B, C)
System Alarms
A. Lists all recorded System alarms in chronological order