August 3, 2019 28
• PV Graphical View
o Displays power production over time for the PV array
o Use up/down buttons to navigate between days
o Month view, Year view, and Total view
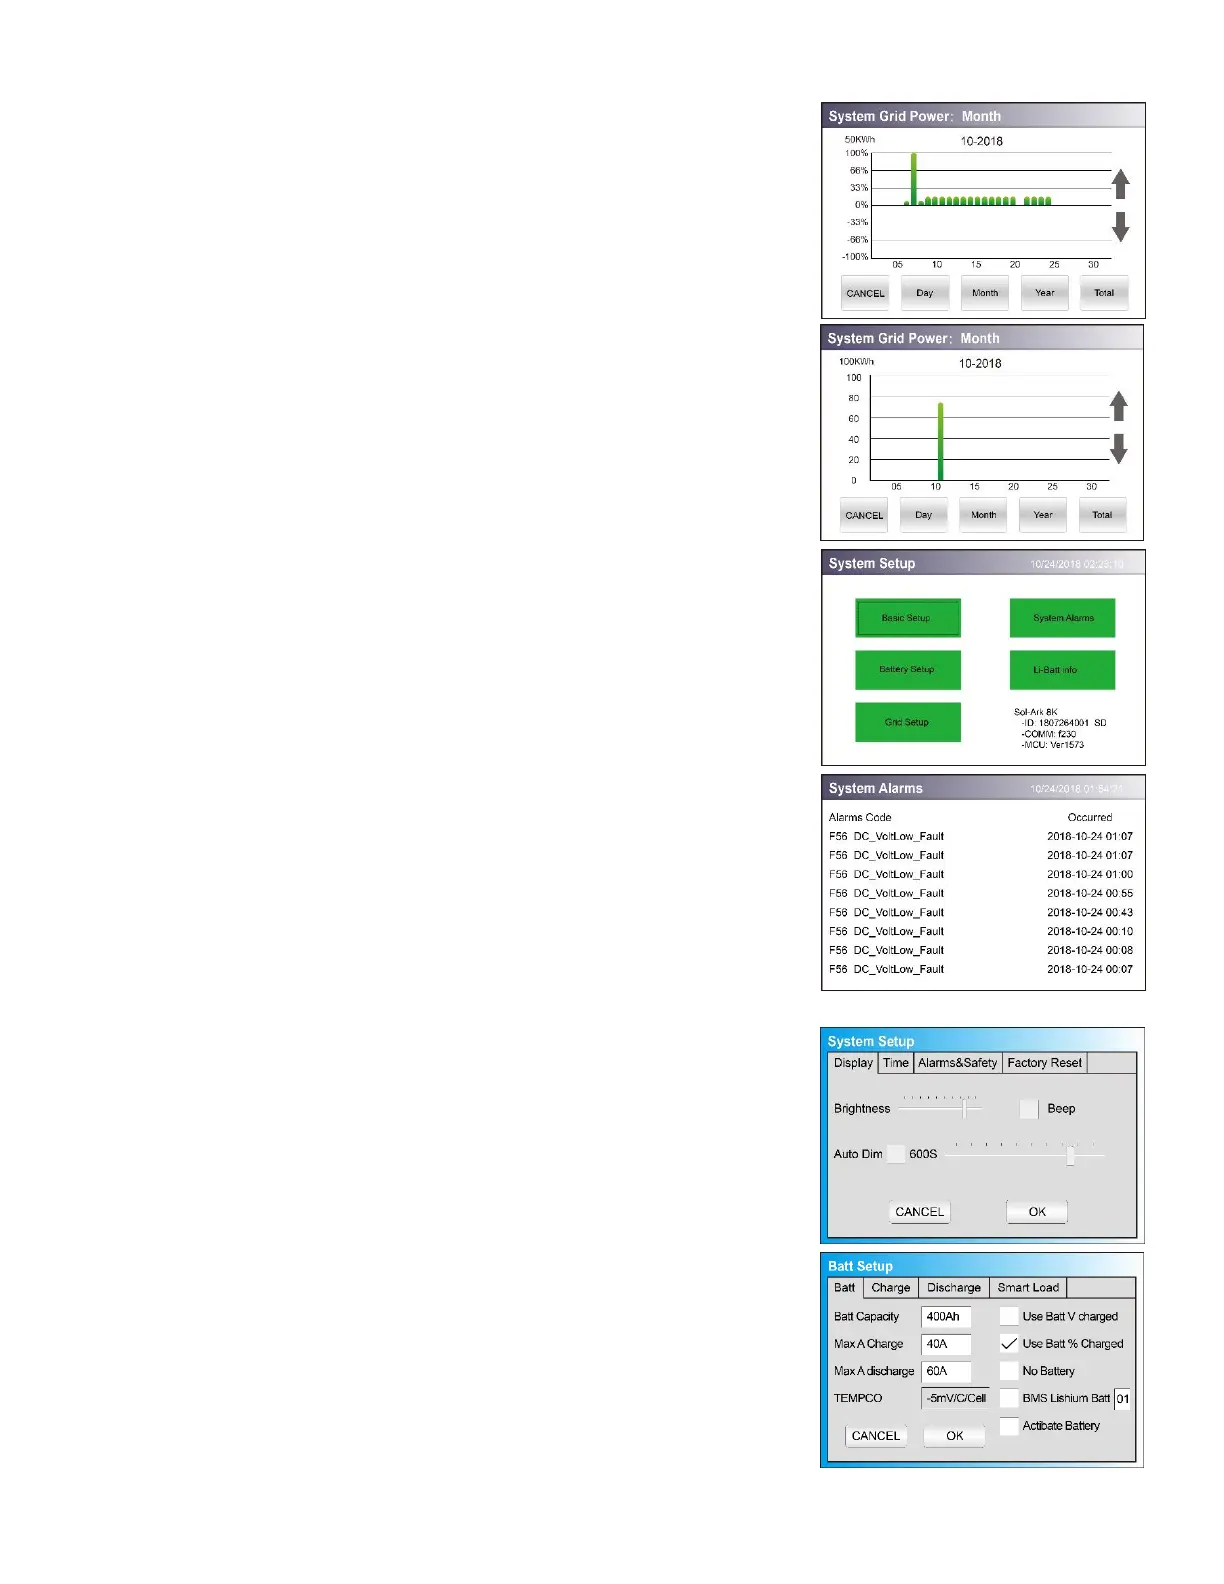
• Grid Graphical View
o Displays power drawn from and sold to the grid over time
o Bars above the line indicate power bought from the grid
o Bars below the line indicate power sold back to the grid
o This view can be helpful in determining when the most power is
used in the home and for time of use programing
• System Setup Menu
o ID = LCD serial #. But we use the WIFI serial #.
o COMM = LCD software version
o MCU = Inverter software version
• System Alarms
o Lists all system alarms
• Basic Setup
o Display
▪ Brightness adjustment
▪ Auto dim (must be enabled for LCD screen to be covered
by warranty)
o Time
▪ Set date and time for the system
o Alarms & Safety
▪ Arc fault detects if a poor connection in the PV wires
• Batt Setup
o Batt
▪ Batt Capacity: enter the size of the battery bank
connected to the system
▪ Max A charge: set the max charge rate for the batteries
(This also sets PV → Battery charge rate)
▪ Suggest 20%-30% of battery capacity for lead acid
▪ Max A discharge: set max discharge for battery bank (this
value will be ignored in off-grid mode to allow for
constant power to loads)
▪ TEMPCO: Temperature coefficient used in conjunction
with the batt temp sensor to adjust optimal voltages for
lead acid batteries
▪ Use Batt V charged: displays battery charge in terms of
voltage
▪ Use Batt % charged: Battery voltage can be misleading
for determining the % Charged. So, we use algorithms
measuring power in and out to measure a true value for
% Charged. It compensates for aging batteries also.
o Charge
▪ Float V: Set value appropriate for the batteries
connected to the system using chart (Page 15/32)