Applications
EXAMPLE. The signal in Figure 3-5 has a period (T) of 16.6 ms.
Calculating frequency (f):
I
T
1
16.6 x 10⁻³ s
= 60 Hz
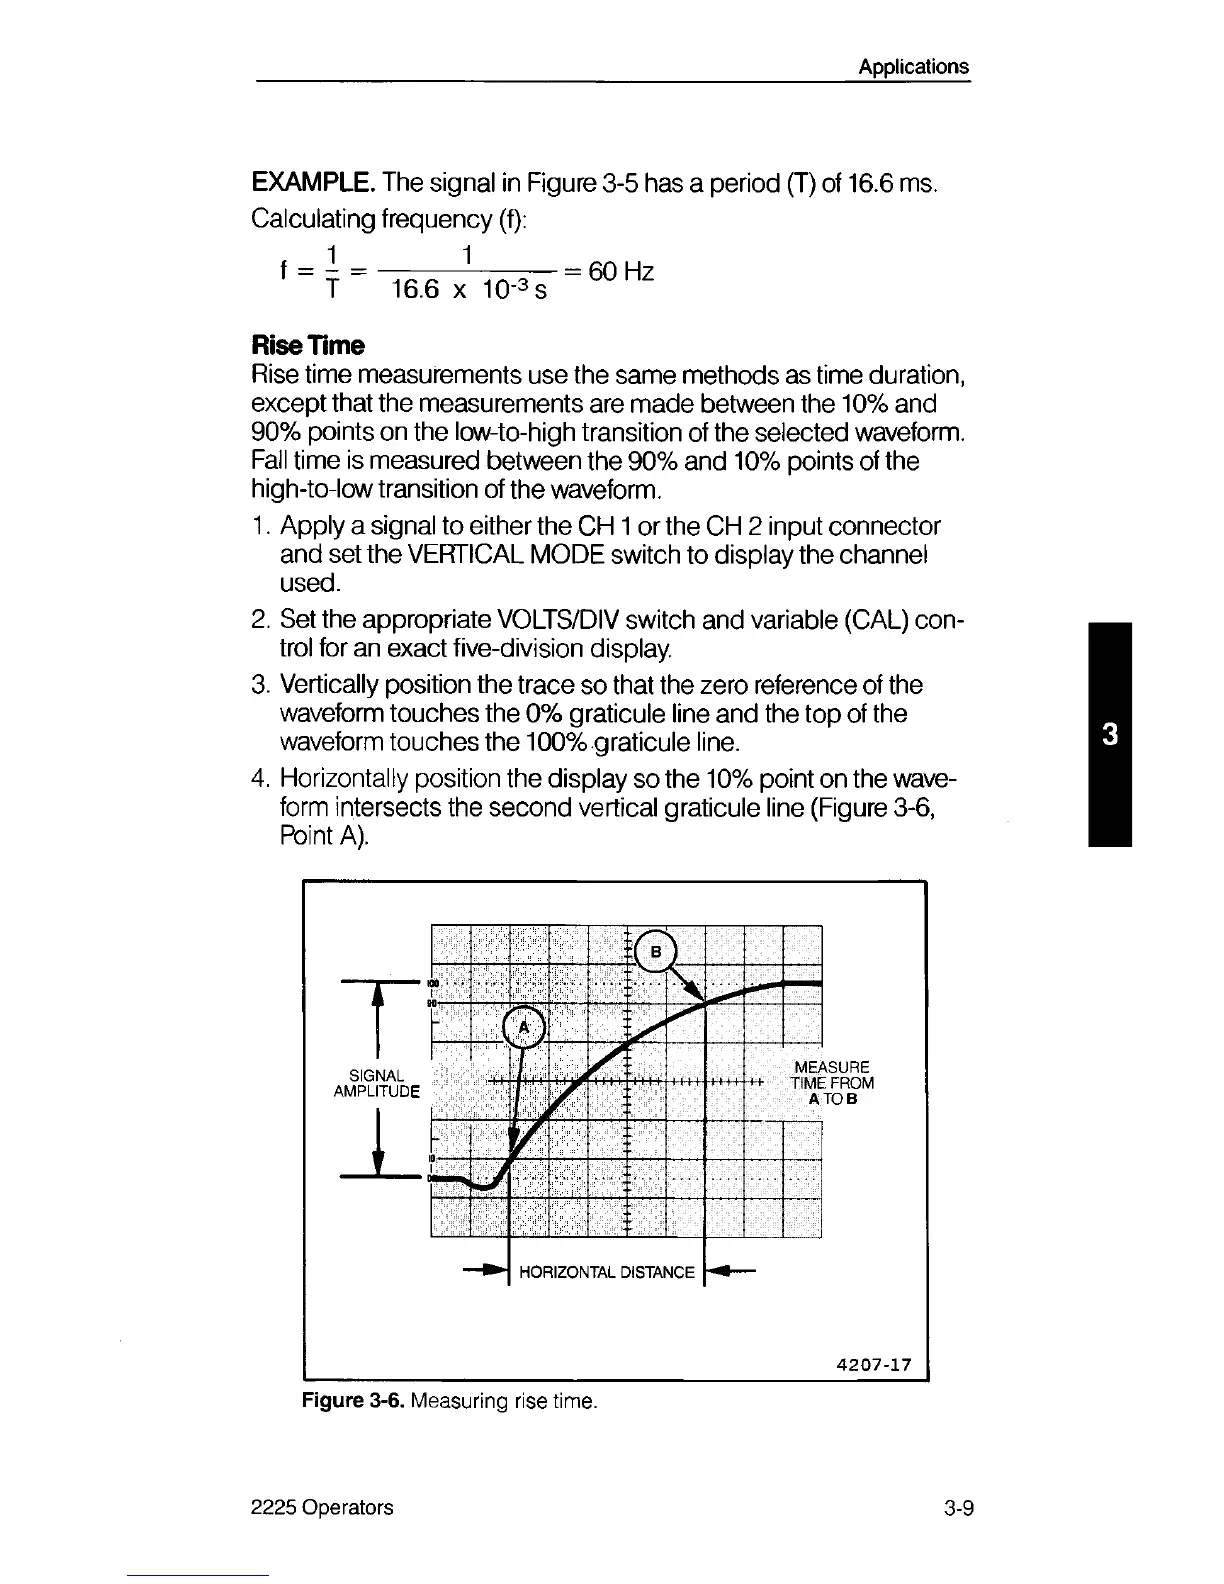
Rise Time
Rise time measurements use the same methods as time duration,
except that the measurements are made between the 10% and
90% points on the low-to-high transition of the selected waveform.
Fall time is measured between the 90% and 10% points of the
high-to-low transition of the waveform.
1. Apply a signal to either the CH 1 or the CH 2 input connector
and set the VERTICAL MODE switch to display the channel
used.
2. Set the appropriate VOLTS/DIV switch and variable (CAL) con
trol for an exact five-division display.
3. Vertically position the trace so that the zero reference of the
waveform touches the 0% graticule line and the top of the
waveform touches the 100% graticule line.
4. Horizontally position the display so the 10% point on the wave
form intersects the second vertical graticule line (Figure 3-6,
Fbint A).
Figure 3-6. Measuring rise time.
2225 Operators
3-9