Specifications
Input frequen
cies 6.2 GHz – 8.0 GHz (typical)
Image: -40 dB
c for 3882 MHz – 4760 MHz Center Frequency, typical
RFx2LO: –25 d
Bc for 4800 MHz – 5150 MHz Center Frequency, typical
–40 dBc for 5150 MHz – 5800 MHz Center Frequency, typical
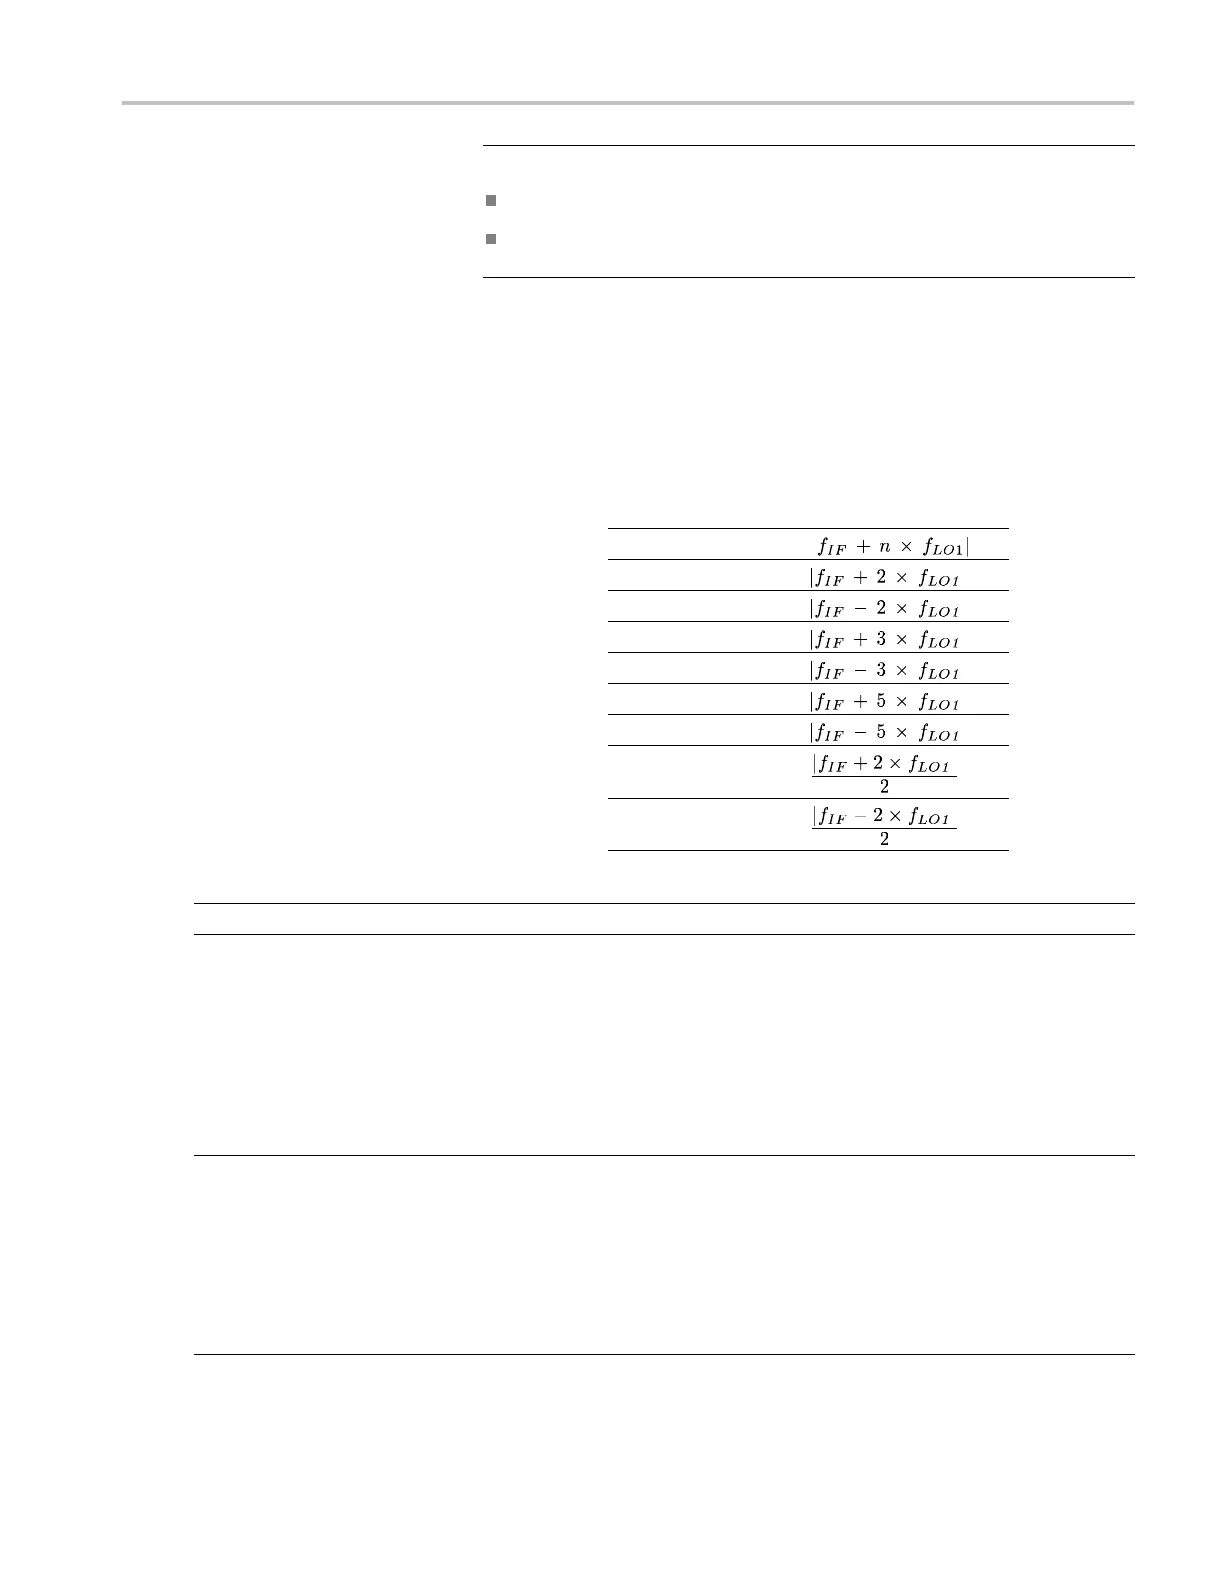
Spurious Response Definitions: For each c enter frequency setting, any on-screen
spurious signals caused by RF input signals (blockers) mixing with local oscillators
(LO1 or LO2)
at a frequency determined by the hardware settings for the IF and
LO1 frequency.
For a given center frequency setting, use the Frequency Tuning Table to determine
the corresp
onding n and the IF and LO1 frequencies. (See Table 1 on page 7.) Use
the formulas below to calculate the required input signal (blocker) frequency w hich
will cause a spur at the center frequency.
Spur Type
Blocker Frequency
(Source Frequency)
|IF1 Image|
|RF+2LO|
|RF-2LO|
|RF+3LO|
|RF-3LO|
|RF+5LO
|
|RF-5LO|
|2RF+2LO|
|2RF-2LO|
RF to I
F Feedthrough
1190 M
Hz or 2440
MHz
Resid
ual FM, typical
<10Hz
p-p
3
RD
order IM d istortion
–60
dBc at center frequency 2130 MHz, reference level = –15 dBm, 18 ⁰Cto28⁰C
–60 dBc at center frequency 2130 MHz, reference level = –15 dBm, –10 ⁰Cto
55 ⁰C, typical
–60
dBc at center frequency 2130 MHz, reference level = –30 dBm, typical
< –58 dBc, 40 MHz to 6.2 GHz, reference level = –10 dBm, typical
< –50 dBc, 40 MHz to 6.2 GHz, reference level = –50 dBm, typical
Two
input CW signals, 1 MHz separation, each input signal level 5 dB below the
reference level setting at the RF input
3
RD
order intercept (TOI) +10 dBm at center frequency 2130 MHz, reference level –15 dBm, 18 ⁰Cto28⁰C
+10 dBm at center frequency 2130 MHz, reference level –15 dBm, –10 ⁰Cto
55
⁰C, typical
–5 dBm at center frequency 2130 MHz, reference level –30 dBm, typical
+14 dBm, 40 MHz to 6.2 GHz, reference level = –10 dBm, typical
–
30 dBm, 40 MHz to 6.2 GHz, reference level = –50 dBm, typical
These are indirectly tested by the 3rd Order IM Distortion test
RSA306 Specifications and Performance Verification 6
 Loading...