Monitoring Audi
o
Usage Notes
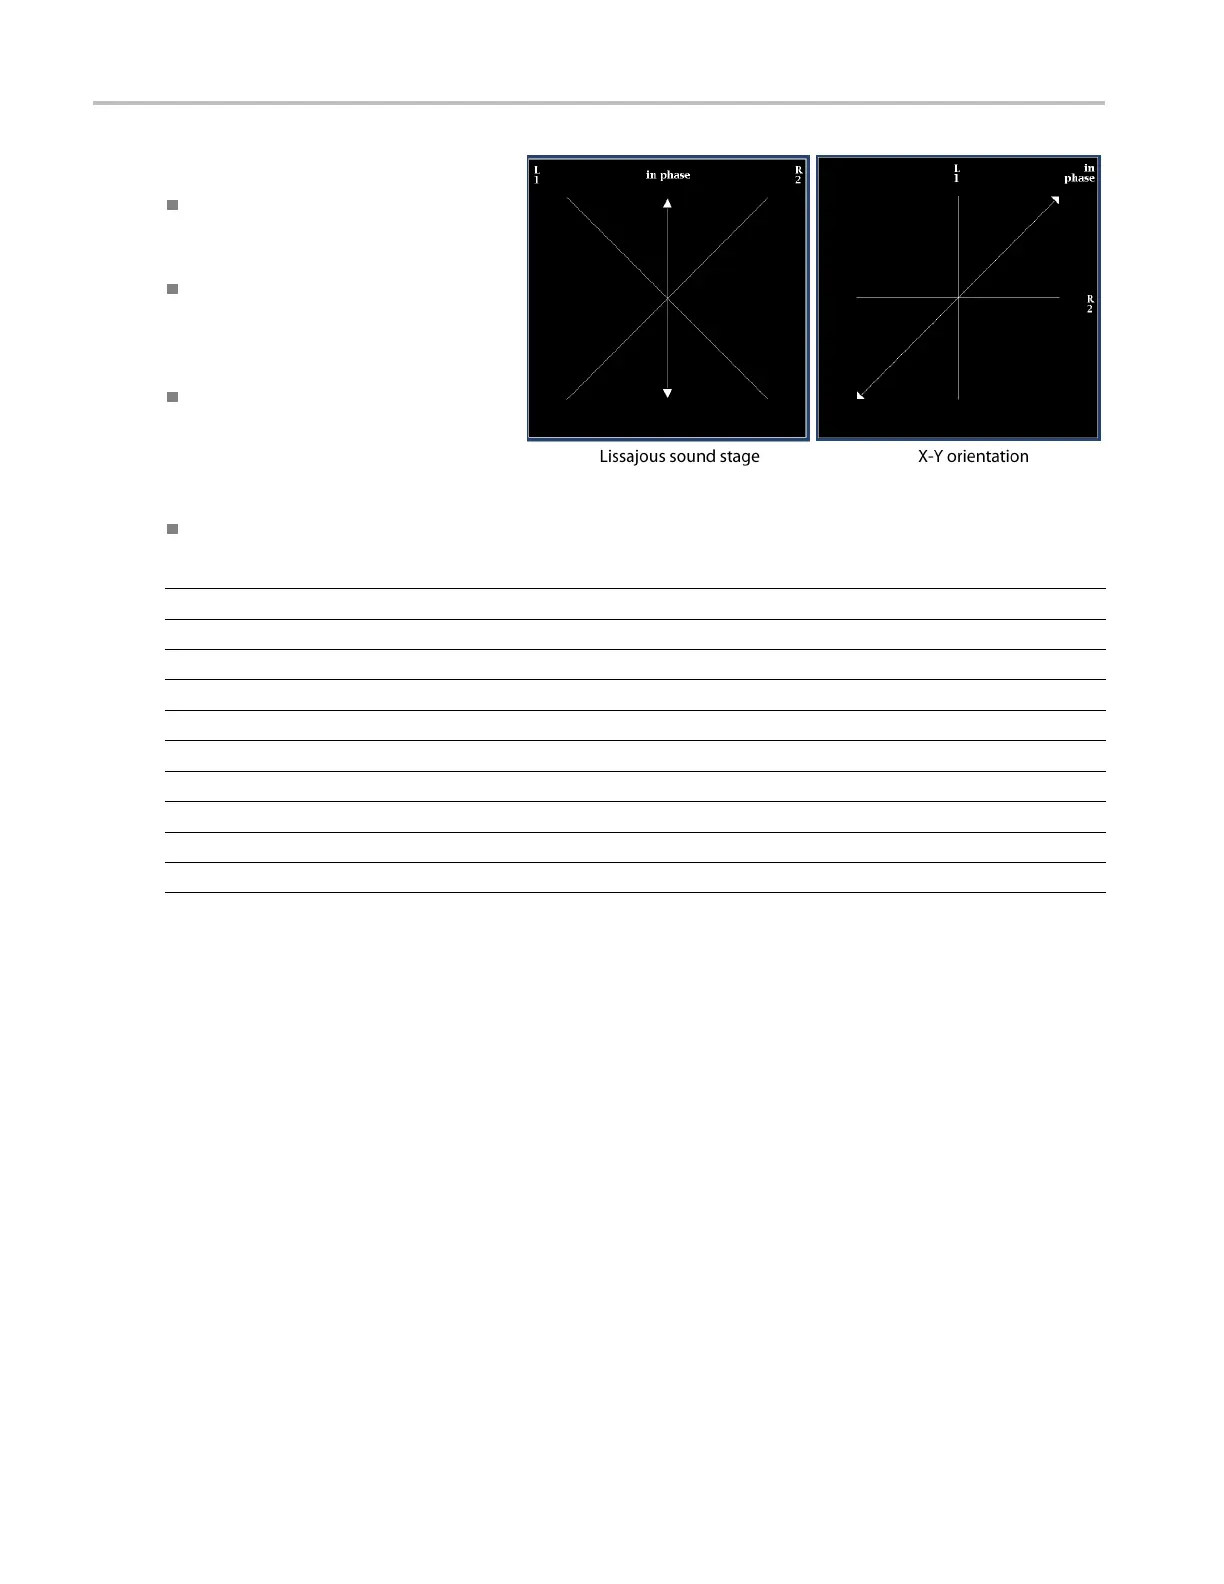
The Lissajous or phase display is a plot
of one channel against another on an
orthogonal pair of axes.
Soundstage plots the two channels
at 45 degree angles, w ith the mono
combination appearing on the vertical
axis—like a left-right image in a studio.
X-Y plots left-channel data on the
vertical axis and right channel data on
the horizontal axis, emulating the X-Y
display of an oscilloscope.
The following response times of the correlation meters can be set from the Configuration menu.
Speed setting Response averaging time (s) Speed setting Response averaging time ( s)
1 0.0167 11 3.0
2 0.0333 12 3.5
3 0.0667 13 4.0
4 0.1333 14 4.5
5
0.2667 15 5.0
6 0.5333 16
5.5
7
1.0 17 6.0
8 (default)
1.5 18 6.5
9 2.0 19 7.0
10 2.5 20
7.5
90 Waveform Rasterizers Quick Start User Manual
 Loading...