4. Press r to see the graph
and trace points.
Note: You can manipulate the
graph to “fit” an object in the
Background Image Var. You can
also use QuickPlot and Fit
Equation to fit an equation to a
shape. (See
QuickPlot
.)
Using QuickPlot and Fit Equation
QuickPlot and Fit Equation allows you to drop points on a graph screen and
model a curve to those points using regression functions. You can select color
and line style, draw points on a graph, and choose an equation to fit the drawn
points. You can then store the results of the plot and equation.
QuickPlot and Fit Equation is an option in the … / menu.
Prior to starting the QuickPlot and Fit Equation interactive feature on the graph
area, be sure to set your Background Image Var and other graph settings from
the FORMAT screen. Also set your WINDOW or ZOOM settings.
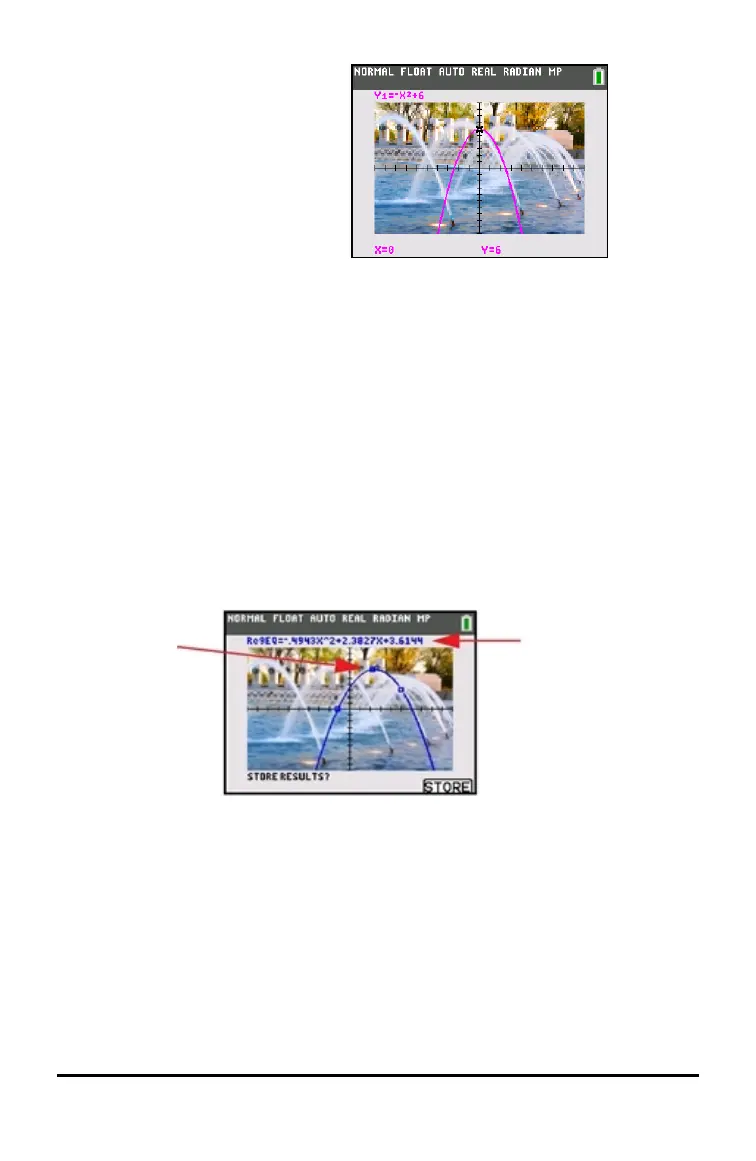
Drop points
on the
screen.
Points can
be saved to
lists.
Calculate the
regression
equation, draw
the curve, and
store the
function.
Working With Images
The TI-84PlusCE uses both pictures and background images. They are both
stored in Flash archive, but they are used in different ways.
Working with Graphs 37

 Loading...


