EasyManuals Logo

Texas Instruments TI-84 Plus CE Getting Started

Texas Instruments TI-84 Plus CE
76 pages
To Next Page IconTo Next Page
To Previous Page IconTo Previous Page
Page #48 background imageLoading...
Page #48 background image
44 Working with Probability and Statistics
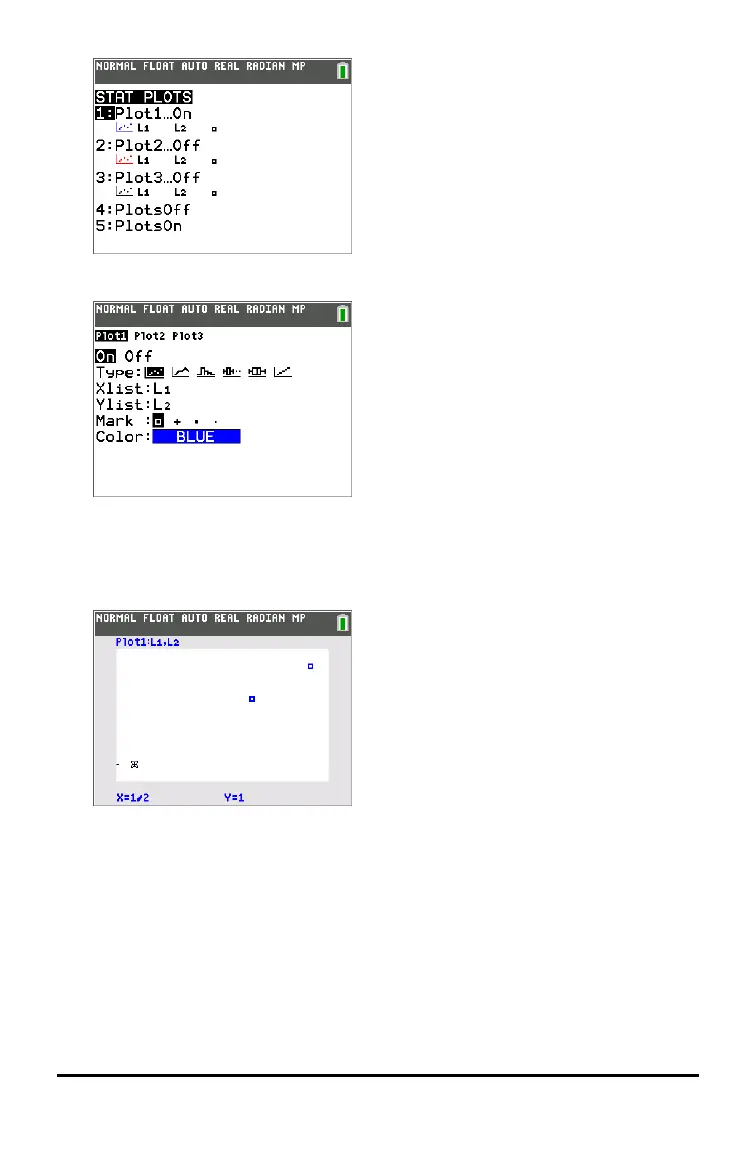
6. Press | to highlight On.
7. Press q to automatically set up a graphing window for your data.
8. Press 9: ZoomStat to see the graph.
9. Press r and arrow keys to trace on the plot.
Note: You can plot your statistics data in these ways:
Scatter plot
xyLine
Histogram
Regular or Modified box-and-whisker plot
Normal probability plot

Other manuals for Texas Instruments TI-84 Plus CE

Questions and Answers:

Question and Answer IconNeed help?

Do you have a question about the Texas Instruments TI-84 Plus CE and is the answer not in the manual?

Texas Instruments TI-84 Plus CE Specifications

General IconGeneral
Programming SupportTI-BASIC, Assembly, C
Display320 x 240 pixels
BatteryRechargeable lithium-ion battery
ConnectivityUSB port
Memory3MB Flash ROM, 154KB RAM
Operating SystemTI-OS
Dimensions7.5 x 3.4 x 0.75 inches
Weight7.6 ounces

Related product manuals