32
32
NC2 0 - Manual - 01 - 2015
FUNCTION CHARACTERISTICS
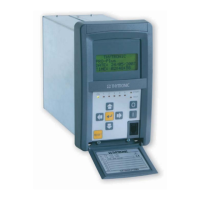
Demand
Phase fi xed demand (I
L1FIX
, I
L2FIX
, I
L3FIX
)
Inside an adjustable time interval t
FIX
, an average magnitude is calculated for phase currents I
L1
, I
L2
,
I
L3
, active power ±P
and reactive power ±Q
of measures taken every second. The average values are
stored at the end of the same time interval.
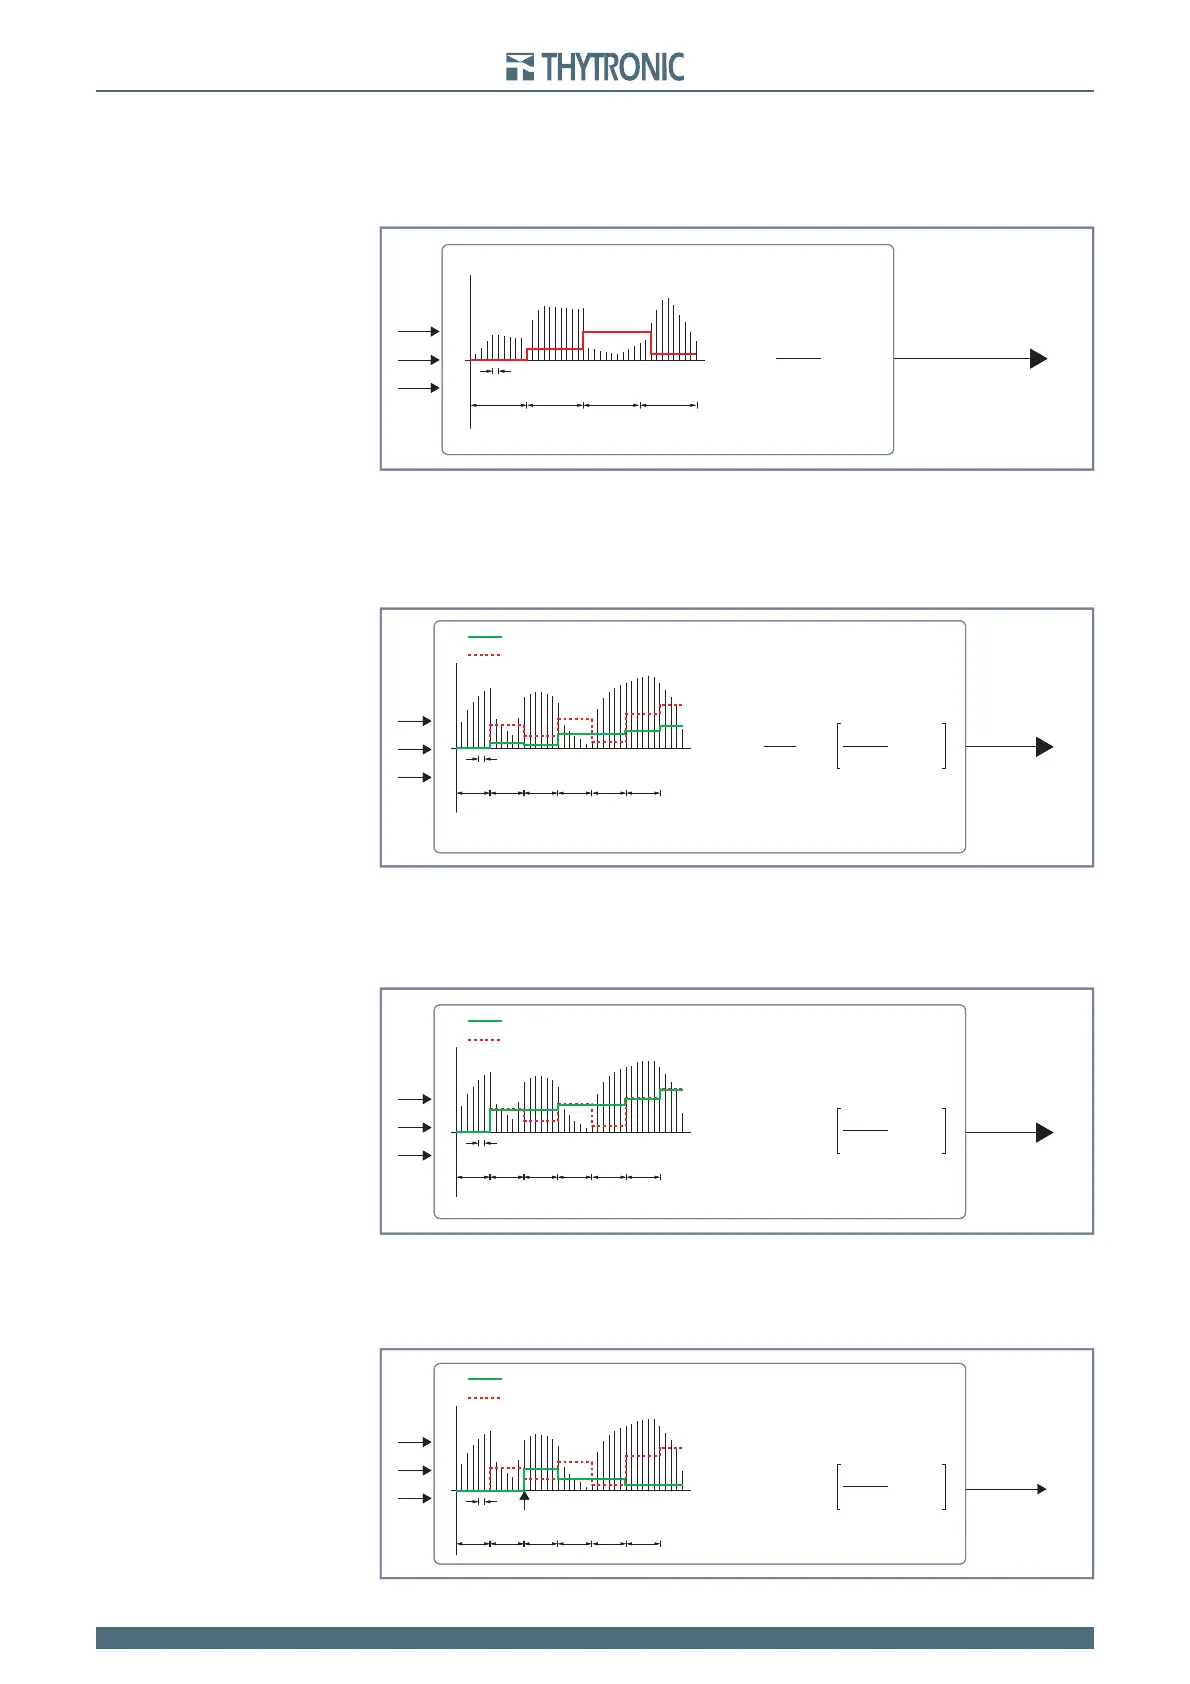
Phase rolling demand (I
L1ROL
, I
L2ROL
, I
L3ROL
)
Inside an adjustable time interval N
ROL
∙t
ROL
, an average magnitude is calculated for phase currents
I
L1
, I
L2
, I
L3
, active power ±P
and reactive power ±Q
of measures taken every second, where t
ROL
is
the length of any time subinterval and N
ROL
is the number of the time intervals. The average values
are stored at the end of the same time subinterval.
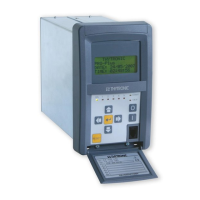
Phase peak (I
L1MAX
, I
L2MAX
, I
L3MAX
)
Inside an adjustable time interval t
ROL
, the maximum magnitude is calculated for phase currents I
L1
,
I
L2
, I
L3
, active power ±P
and reactive power ±Q
of measures taken every second. The average values
are stored at the end of the same time interval t
ROL
(Rolling demand common parameter).
Phase ,inimum (I
L1MIN
, I
L2MIN
, I
L3MIN
)
Inside an adjustable time interval t
ROL
, the minimum magnitude is calculated for phase currents I
L1
,
I
L2
, I
L3
, active power ±P
and reactive power ±Q
of measures taken every second. The average values
are stored at the end of the same time interval t
ROL
(Rolling demand common parameter).
•
•
•
•
Fix-Demand.ai
1s
I
L1FIX
, I
L2FIX
,I
L3FIX
t
FIX
(I
n
)
I
L2
I
L1
I
L3
I
LxFIX
I
Lxn
t
FIX
∙ 60
t
FIX
∙ 60
n=1
¥
1
t
FIX
t
FIX
t
FIX
Fix-Demand.ai
1s
I
L1FIX
, I
L2FIX
,I
L3FIX
t
FIX
(I
n
)
I
L2
I
L1
I
L3
I
LxFIX
I
Lxn
t
FIX
∙ 60
t
FIX
∙ 60
n=1
¥
1
t
FIX
t
FIX
t
FIX
Rol-Demand.ai
Rolling demand example with
N
ROL
=4
I
L1ROL
I
L2ROL
I
L3ROL
(I
n
)
I
L2
I
L1
I
L3
012345
1s
t
ROL
t
ROL
N
ROL
t
ROL
t
ROL
t
ROL
6
t
ROL
Average inside subinterval t
ROL
I
LxROL
= I
Lxk
t
ROL
∙60
t
ROL
∙60
k=1
¥
N
ROL
n=1 n
¥
1
N
ROL
1
Rol-Demand.ai
Rolling demand example with
N
ROL
=4
I
L1ROL
I
L2ROL
I
L3ROL
(I
n
)
I
L2
I
L1
I
L3
012345
1s
t
ROL
t
ROL
N
ROL
t
ROL
t
ROL
t
ROL
6
t
ROL
Average inside subinterval t
ROL
I
LxROL
= I
Lxk
t
ROL
∙60
t
ROL
∙60
k=1
¥
N
ROL
n=1 n
¥
1
N
ROL
1
Max-Demand.ai
Maximum value of averages inside time interval
t
ROL
Average inside time interval
t
ROL
I
L1MAX
I
L2MAX
I
L3MAX
(I
n
)
I
L2
I
L1
I
L3
1s
t
ROL
t
ROL
t
ROL
t
ROL
t
ROL
t
ROL
MAX
I
LxMAX
= I
Lxn
t
ROL
∙60
t
ROL
∙60
n=1
¥
1
Max-Demand.ai
Maximum value of averages inside time interval
t
ROL
Average inside time interval
t
ROL
I
L1MAX
I
L2MAX
I
L3MAX
(I
n
)
I
L2
I
L1
I
L3
1s
t
ROL
t
ROL
t
ROL
t
ROL
t
ROL
t
ROL
MAX
I
LxMAX
= I
Lxn
t
ROL
∙60
t
ROL
∙60
n=1
¥
1
Min-Demand.ai
Minimum value of averaged inside time intervalt
ROL
Average inside time interval
t
ROL
Reset
I
L1MIN
I
L2MIN
I
L3MIN
(I
n
)
I
L2
I
L1
I
L3
1s
t
ROL
t
ROL
t
ROL
t
ROL
t
ROL
t
ROL
MIN
I
LxMIN
= I
Lxn
t
ROL
∙60
t
ROL
∙60
n=1
¥
1
Min-Demand.ai
Minimum value of averaged inside time intervalt
ROL
Average inside time interval
t
ROL
Reset
I
L1MIN
I
L2MIN
I
L3MIN
(I
n
)
I
L2
I
L1
I
L3
1s
t
ROL
t
ROL
t
ROL
t
ROL
t
ROL
t
ROL
MIN
I
LxMIN
= I
Lxn
t
ROL
∙60
t
ROL
∙60
n=1
¥
1