The grey vertical bar with a blue arrow, located far right of the screen, is the legend. Clicking on it will display an
accurate description of the different curves (Discharge pressure, Suction pressure when available, Cut-In and Cut-
Out) each with their respective colors.
Between the “0” pressure value and the horizontal axis, a short series of narrow horizontal zones are displayed.
They are described in the “Indicators” section of the legend. These zones indicate when the engine was running
and when a jockey pump was running by colorizing small sections of the horizontal zone whenever the condition is
occurring.
As indicated earlier, the “Textual Mode” is available by pressing the “Select” button on the navigation pad. This will
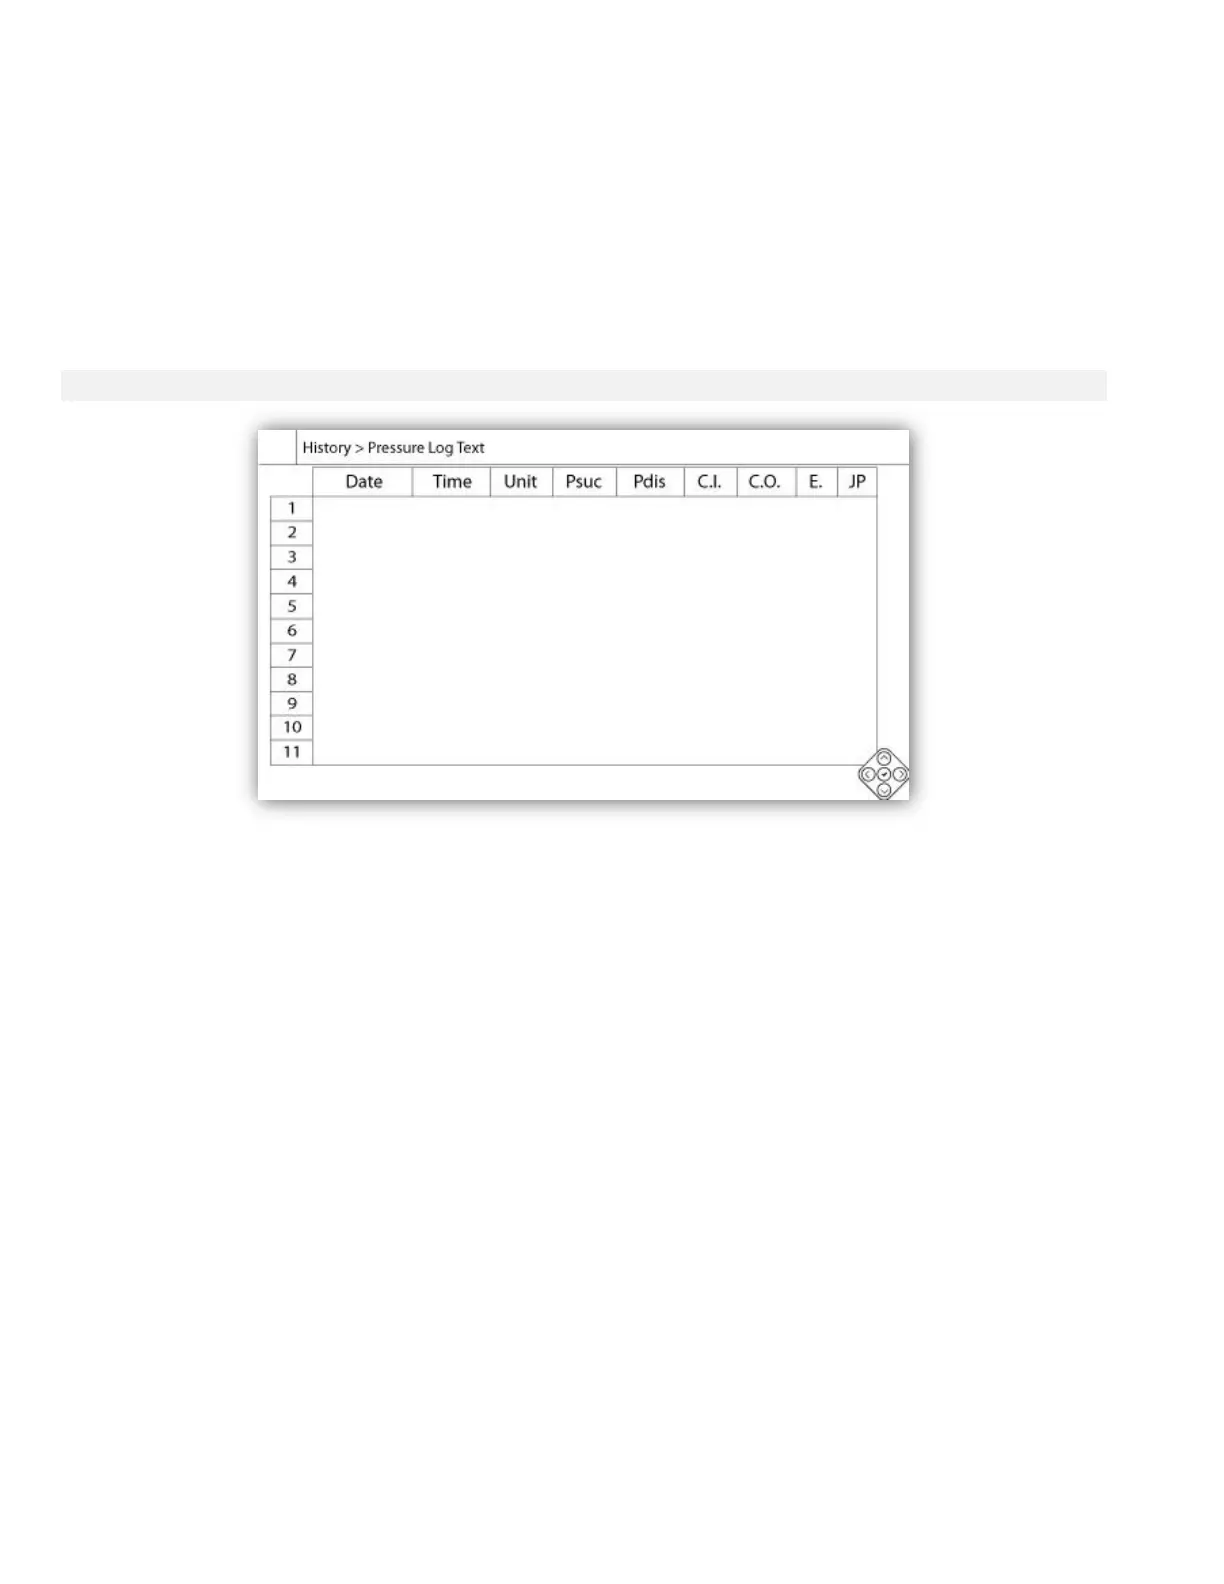
represents the pressure logs in a table form, allowing for a more precise reading (see “Textual Mode” right below).
The “Pressure Log text” shows a table with 10 rows. The total number of rows available is 500 and the logs are
sorted in chronological order. To see more logs, please download all logs on a USB Device.
Description of the columns :
-Date: Date when the log was recorded
-Time: Time when the log was recorded
-Unit: Actual pressure unit when the log was recorded
-Suc.: Suction pressure value
-Dis.: Discharge pressure value
-C.I.: Cut-In value when the log was recorded
-C.O.: Cut-Out value when the log was recorded
-ER: The cell will become green if the engine was running for that specific pressure log.
-JP: The cell will become green if the jockey pump was running for that specific pressure log.
The contextual navigation pad is implemented in this page. It allows for quick navigation functions, like “Page Up”,
“Page Down”, “First Page”, “Last Page” and “Graphical Mode”. As always, clicking on the Navigation Pad Icon in the
lower right corner of the screen will pop-up the Navigation Pad functions specific for this page. By pressing these
buttons, the displayed rows will shift, allowing a quick user-friendly navigation.