72
Tx Packets Displays the total number of the sent packets on the current band since the
EAP starts up.
Rx Bytes Displays the total received traffic on the current band since the EAP starts
up.
Tx Bytes Displays the total sent traffic on the current band since the EAP starts up.
Rx Dropped
Packets
Displays the total number of the dropped packets which are received on
the current band since the EAP starts up.
Tx Dropped
Packets
Displays the total number of the dropped packets which are sent on the
current band since the EAP starts up.
Rx Errors Displays the total number of error packets which are received on the
current band since the EAP starts up.
Tx Errors Displays the total number of error packets which are sent on the current
band since the EAP starts up.
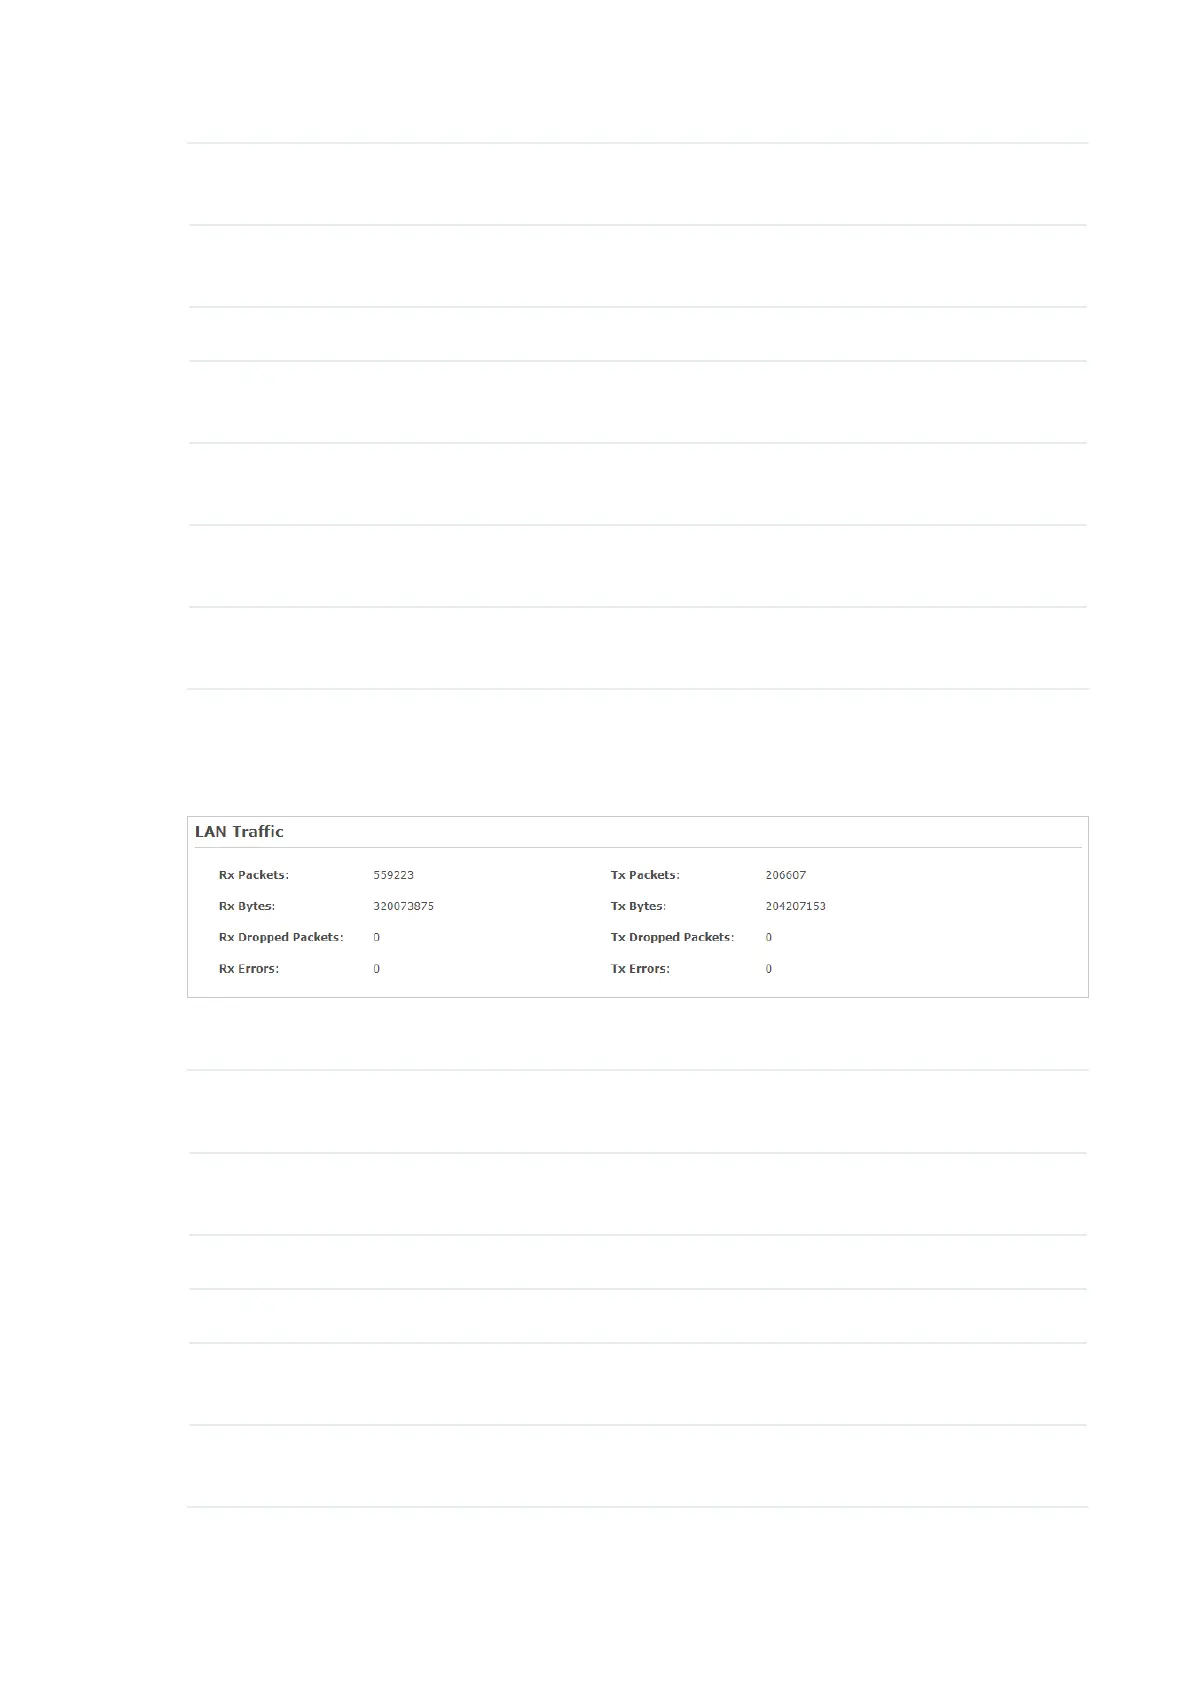
Monitor LAN Traffic
You can view the LAN traffic of EAP.
The following traffic information of the LAN is displayed:
Rx Packets Displays the total number of received packets in the LAN since the EAP
starts up.
Tx Packets Displays the total number of sent packets in the LAN since the EAP starts
up.
Rx Bytes Displays the total received traffic in the LAN since the EAP starts up.
Tx Bytes Displays the total sent traffic in the LAN since the EAP starts up.
Rx Dropped
Packets
Displays the total number of the dropped packets which are received by the
EAP since it starts up.
Tx Dropped
Packets
Displays the total number of the dropped packets which are sent by the
EAP since it starts up.