EasyManua.ls Logo

Trane Tracer AdaptiView - Viewing Data Graphs

Trane Tracer AdaptiView
92 pages
To Next Page IconTo Next Page
To Previous Page IconTo Previous Page
Loading...
CTV-SVU01G-EN
33
Chiller Overview 2
Evaporator
Condenser
CCiirrccuuiitt 11
Oil System
Approach Temperature
Compressor
Motor
Motor Temperature
Purge
CCiirrccuuiitt 22
Oil System
Approach Temperature
Compressor
Motor
Motor Temperature
Purge
Viewing Data Graphs
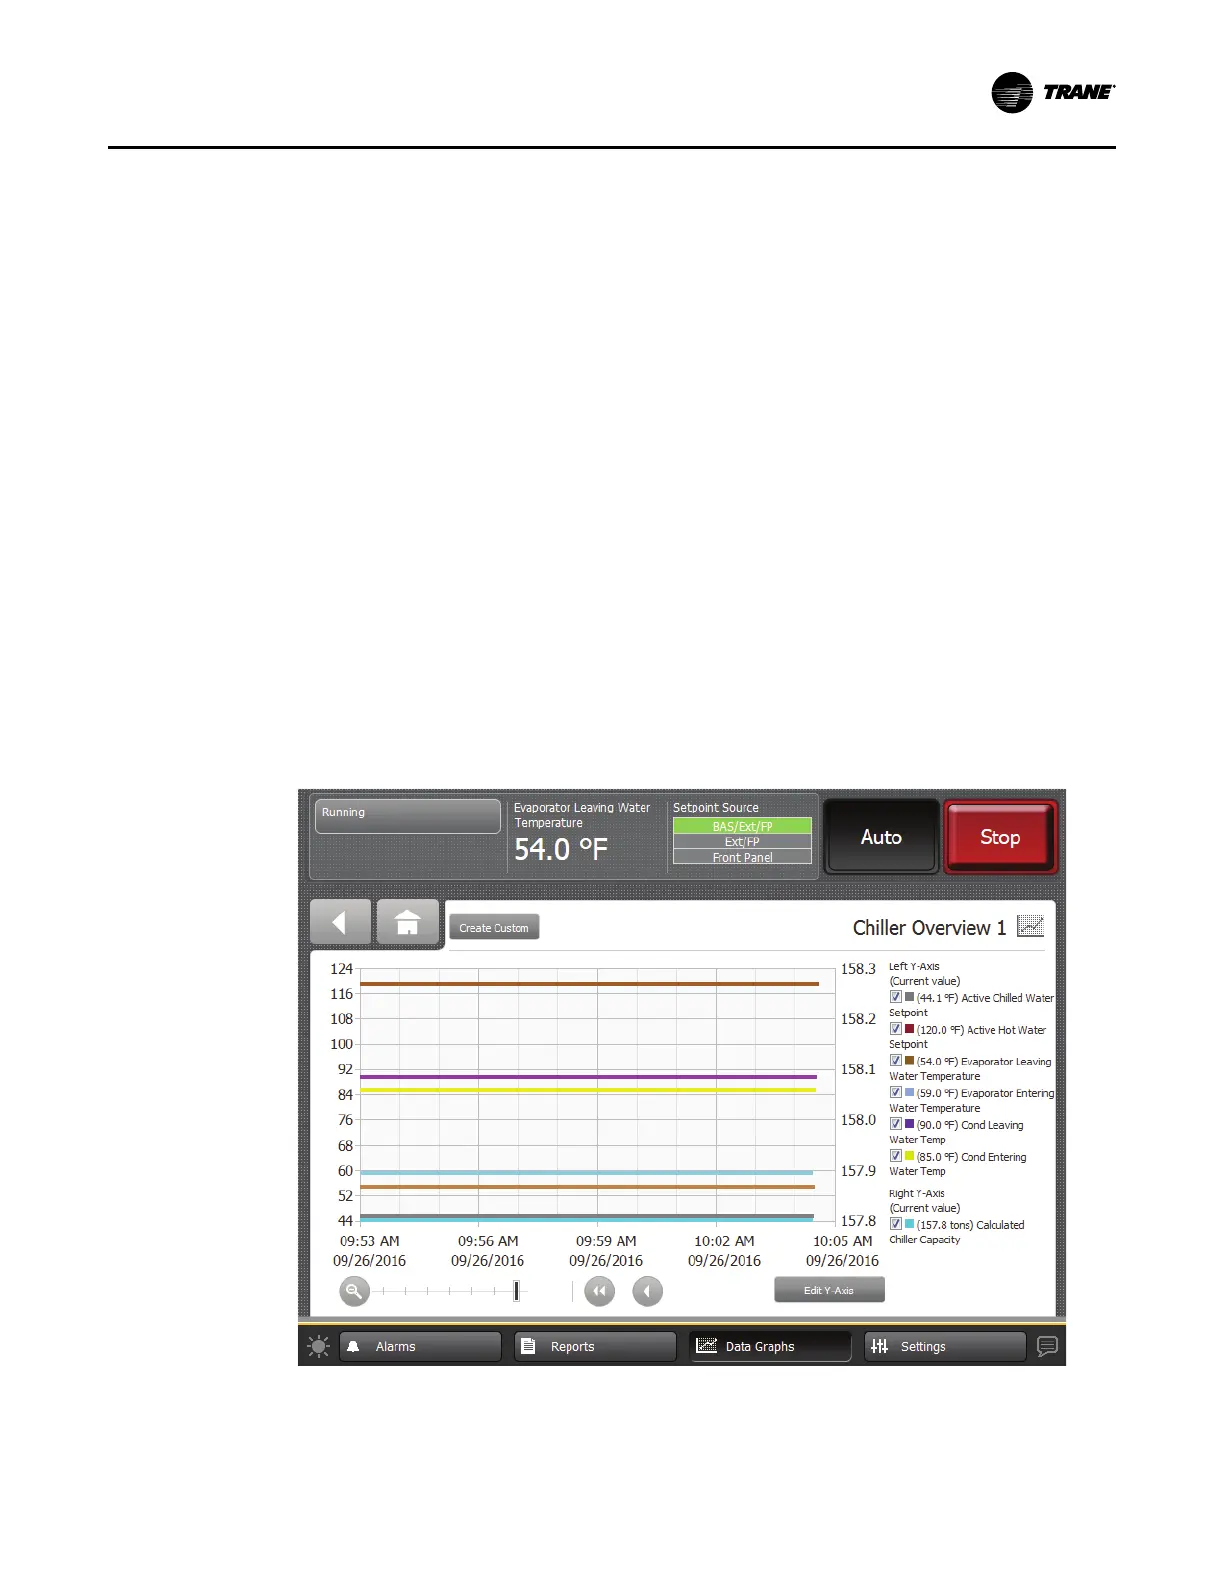
On the Data Graphs screen, touch any of the buttons to view a live graph. (The following
figure shows Chiller Overview 1 as an example). For every graph, the X-axis shows time. The Y-
axes presents data points specific to each graph. The data points are listed in “The Data Graphs
Screen,” p. 32.
Figure 15. Example of Data Graph (Chiller Overview 1 shown)
DDaattaa GGrraapphhss

Table of Contents

Other manuals for Trane Tracer AdaptiView

Related product manuals