Operation
Stats
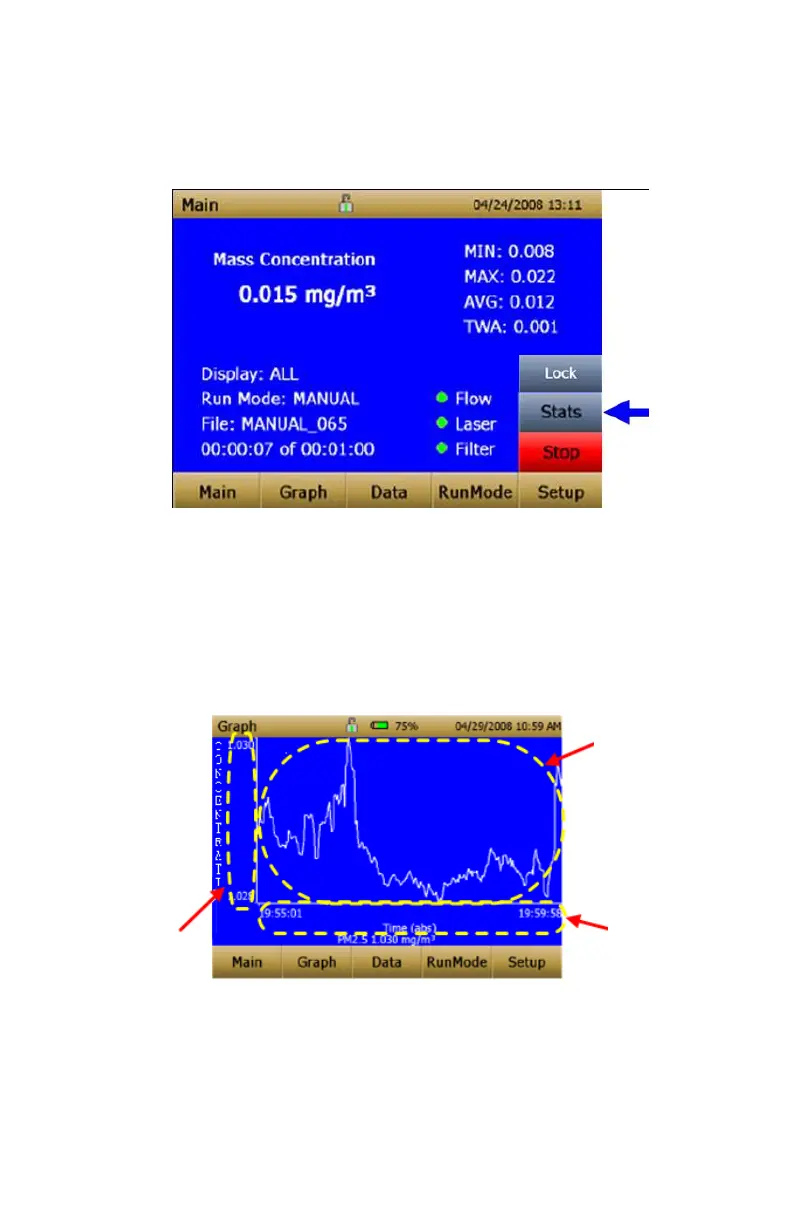
The Stats button shows the statistics of the mass measurement. When the
Stats button is pressed, the main mass reading will reduce in font size, and
the measurement statistics will show on the right side of the screen.
Graphing
During sampling, pressing the Graph button displays current readings in
graphical form.
During Survey Mode, five (5) minutes of running real-time data is
displayed graphically.
During Logging Mode, the entire log test time is displayed on the graph.
 Loading...