HandyLab 100 Operation
33
ba77062d02 12/2017
Note
You can display the slope in the units, mV/pH or % (see page 28).
Stability control The calibration procedure automatically activates the stability control
function. The current measurement with stability control can be termi-
nated at any time (accepting the current value).
Calibration record The new calibration values are displayed when the calibration is fin-
ished.
Display calibration data You can have the data of the last calibration displayed (see page 41).
Calibration evaluation After calibrating, the meter automatically evaluates the calibration.The
zero point and slope are evaluated separately. The worse evaluation of
both is taken into account. The evaluation appears on the display and
in the calibration record.
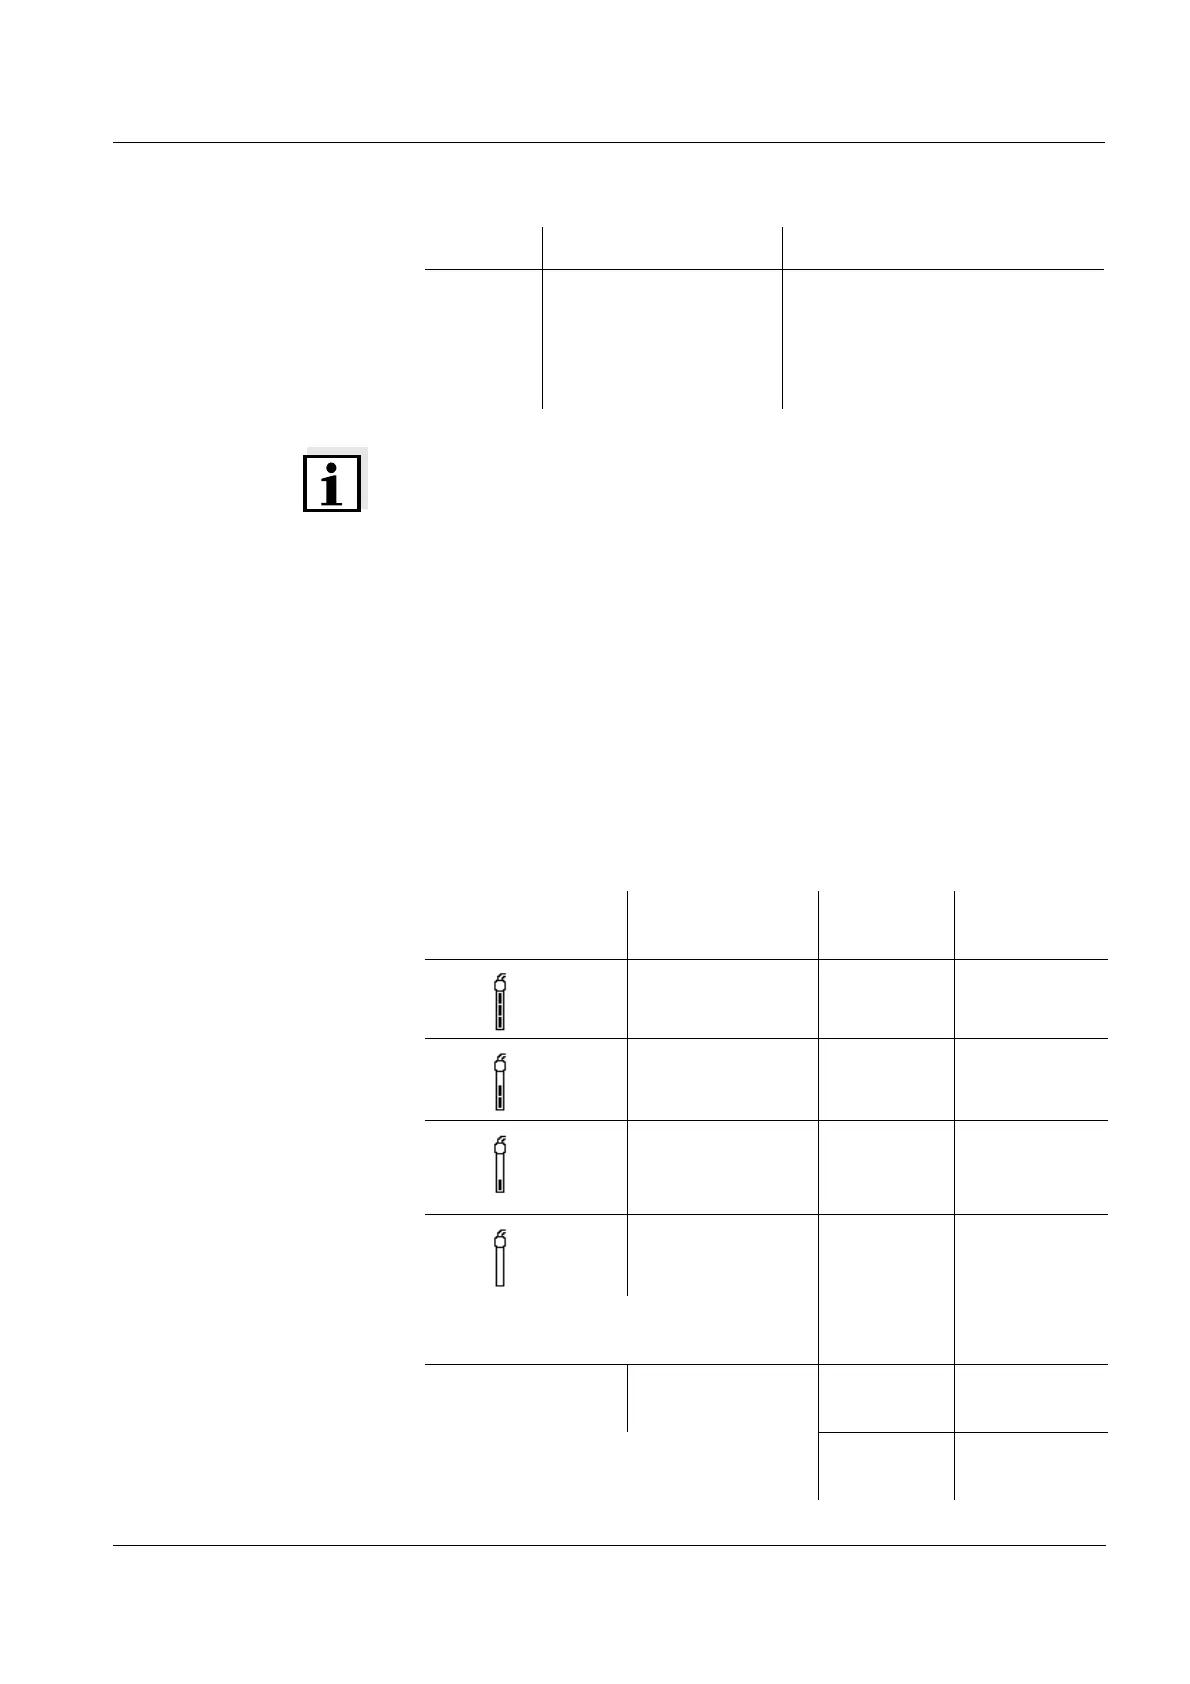
3-point to
5-point
Asy
Slp.
Zero point = Asy
Slope = Slp.
The calibration line is calcu-
lated by linear regression.
Determined values Displayed calibration data
Display Calibration
record
Zero point
[mV]
Slope [mV/
pH]
+++ -15 ... +15 -60,5 ... -58
++ -20 ... +20 -58 ... -57
+ -25 ... +25 -61 ... -60.5
or
-57 ... -56
- -30 ... +30 -62 ... -61
or
-56 ... -50
Clean the electrode according to the
electrode operating manual
Error Error
< -30 or
> 30
... -62 or
... -50
Eliminate the error according to chapter
6 W
HAT TO DO IF... (page 50)