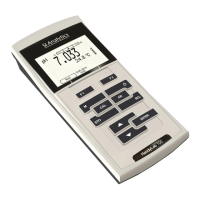
Lab 855 pH value
ba77143e02 12/2017 23
14. When measuring without temperature sensor: Enter the temperature of
the buffer with <><>.
15. Start the measurement with <ENTER> .
The pH value of the buffer solution is displayed.
The measured value is checked for stability (stability control).
The [AR] status display flashes.
16. Wait for the measurement with stability control to be completed.
17. Set the nominal pH value of the buffer solution with <><>.
18. Accept the calibration value with <ENTER>.
The calibration record is displayed.
5.2.5 Calibration points
Depending on the number of buffer solutions used, the meter determines the
following values and calculates the calibration line:
5.2.6 Calibration data
Displaying the calibration data
1. Display the calibration data in the measured value display with <CAL__>.
The value for the asymmetry (ASY) is displayed.
Calibration
Values deter-
mined
Displayed calibration data
1-point Asy
• Zero point = Asy
• Slope = Nernst slope
(-59.2 mV/pH at 25 °C)
2-point Asy
Slo
• Zero point = Asy
• Slope = Slo
The calibration line goes through both cali-
bration points.
3-point Asy
Slo
• Zero point = Asy
• Slope = Slo
The calibration line is calculated by linear
regression.
You can display the slope in the units, mV/pH or % (see section
5.2.6 C
ALIBRATION DATA, page 23).