SonTek, a Xylem brand
RiverSurveyor S5/M9 System Manual (February 2013)
89
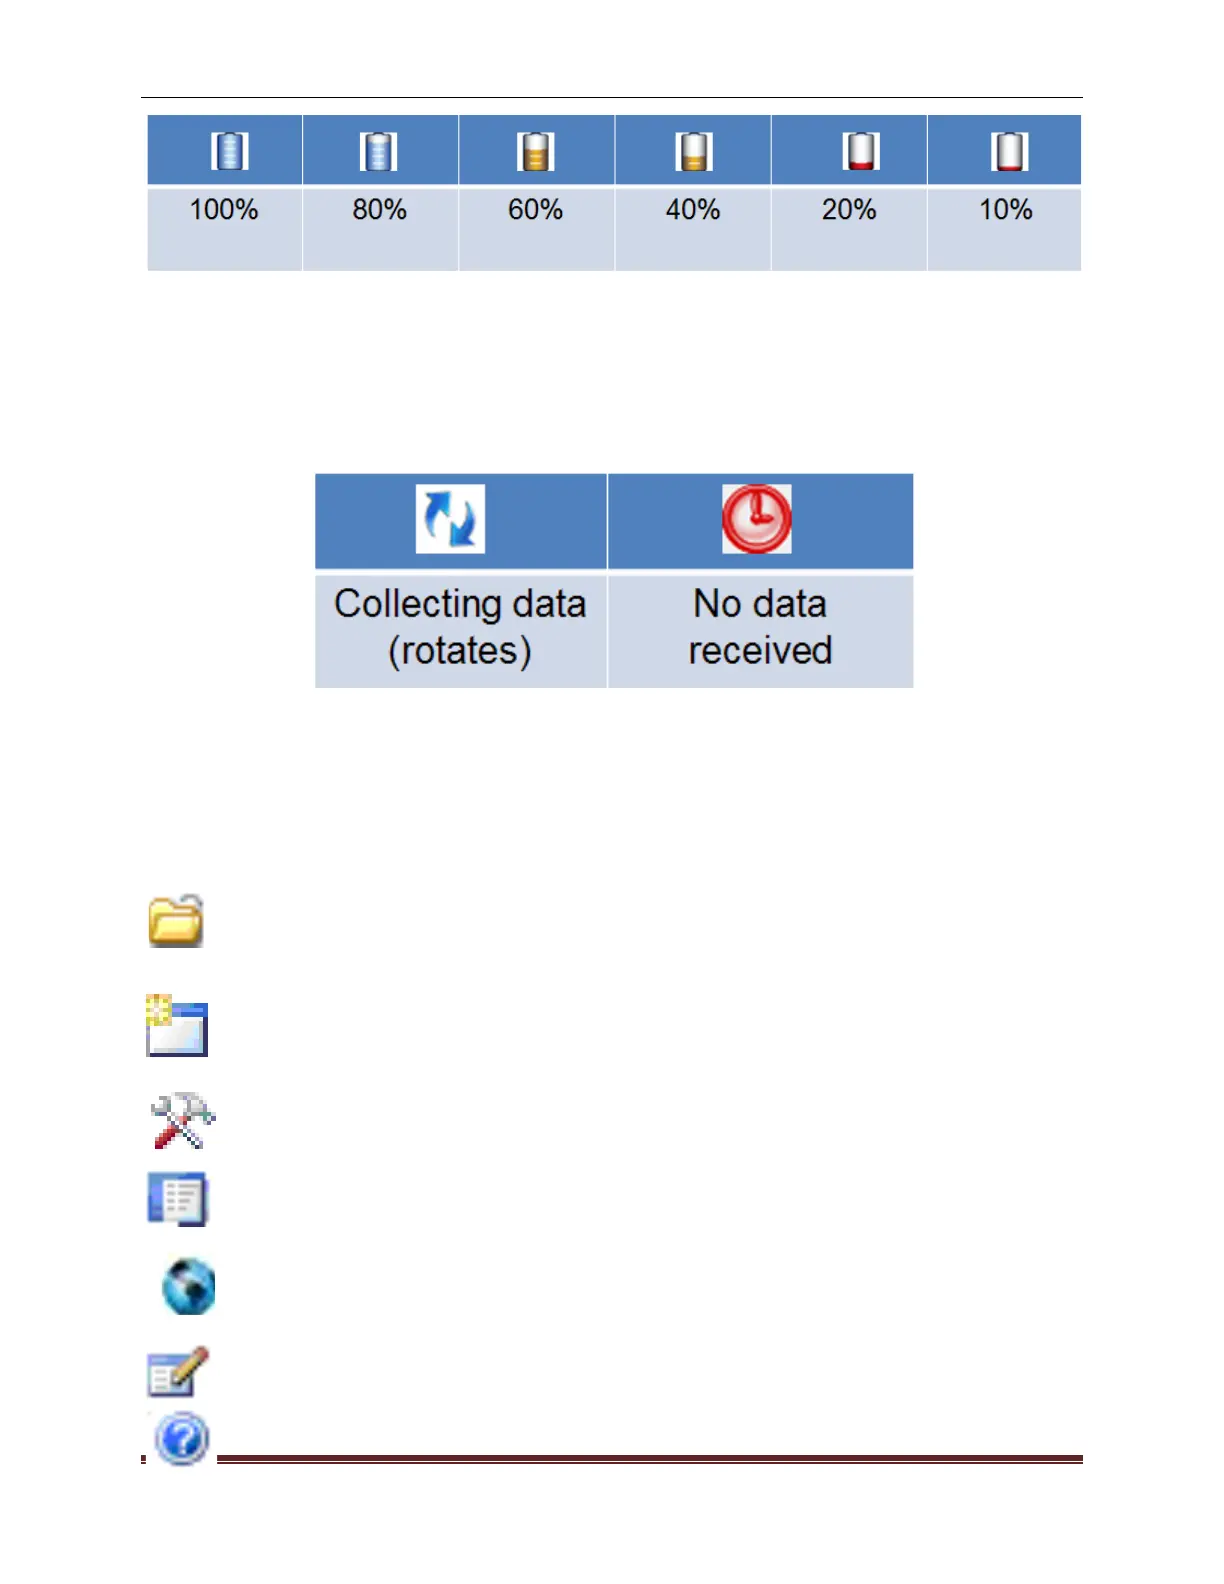
Data Collection is verified using the two icons below. Blue rotating arrows indicate that the sys-
tem is actively collecting data. The red clock-like icon indicates that the system is not collecting
data and a detailed review of system and application settings should be completed in order to
identify any possible problems.
• Collecting Data – During data collection the blue arrows (above) will move in a circular
motion, indicating that data collection is active.
• No Data Reception – The red icon (above) indicates loss of communications. Re-check
communications connections and the range of the system.
RiverSurveyor Live for PC Menu Bar is used for the initial setup and startup. Icon utilities are
self explanatory; however a brief description is included below:
Open File (Ctrl + O) – Opens a window that allows users to select files to open and
evaluate using post-processing tools.
Connect (Ctrl + N) – Allows the selection of communications types with the RiverSur-
veyor: for a direct connect option or a SS radio connection select a Com Port, while
Bluetooth users should click on the tick-box at the bottom of the window.
Show/Hide Processing Toolbox (Ctrl + N) – Toggle button shows or hides the Pro-
cessing Toolbox for post-processing analysis.
Show/Hide Discharge Summary (Ctrl + S) – Toggle button shows or hides the Dis-
charge Summary for post-processing analysis.
Load GIS Shape File – Opens a window with options to look for and load pre-saved
geo referenced Shape File that can be used as a background for the data collected.
This is a useful visualization tool for user in post-processing.
Change Program Settings – Opens a pop-up window which presents default program
settings--English or Metric Units for example.
View Documentation – Presents help documents.
 Loading...
